A redesign is usually intended to produce a change in the user experience. We want to make the experience better (faster, easier, or more enjoyable). But better compared to what? Establishing a UX benchmarking practice is a great way to make sure you’re moving in the right direction and that you have a clear reference point for any improvements.
UX benchmarking refers to evaluating a product or service’s user experience by using metrics to gauge its relative performance against a meaningful standard.
How Benchmarking Works
We refer to benchmarking as a practice because, ideally, once you begin benchmarking, you can track your progress over time, again and again, redesign through redesign — it’s an ongoing process.
Essentially, benchmarking involves collecting quantitative data that describes the experience. For example, we might collect any of the following UX metrics:
- Average time to make a purchase
- Numbers of clicks on a Submit button
- Success rate for an application completion
- Average ease-of-use rating for creating an account
- Eight-week retention rate for an app (percentage of users continuing to use the app after eight weeks)
You can collect those UX metrics using potentially any quantitative methodology, but analytics, surveys, and quantitative usability testing are the three methods that often work best for benchmarking. You can also use customer-service data (for example, the number of support emails about a specific task).
Once you have those numbers, you have to compare them to something. A single number is meaningless, since you have no idea whether it’s good or bad. With benchmarking, you can compare your UX metrics against four different possible reference points.
|
Compare Against |
Example |
|
An earlier version of the product or service |
In 2019, the average time to make a purchase was 58 seconds. After our recent redesign, the average time to make a purchase is now 43 seconds. |
|
A competitor |
Our success rate for application completion is 86%, while our competitor’s is 62%. |
|
An industry standard |
The average ease-of-use rating for creating an account on our hotel’s website is 5.3/7. The average ease-of-use rating for that task in a study of the top 6 hotel websites was 6.5/7. |
|
A stakeholder-determined goal |
Our eight-week retention rate is 8%, but we’re aiming for at least 15%. |
There’s no reason you couldn’t compare against several of these reference points. When you take your first benchmarking metrics (often called the baseline), you won’t have data from earlier versions to compare against, so it’s good to compare against a competitor or industry standard at that point.
If you work in a very niche or private industry, it may be challenging to find the exact industry standards you want. Sometimes academic institutions will publish useful data. In addition, Jeff Sauro’s team at MeasuringU.com conducts industry-standard studies for major business sectors (for example, banking, airlines, hotels, etc.).
When to Benchmark
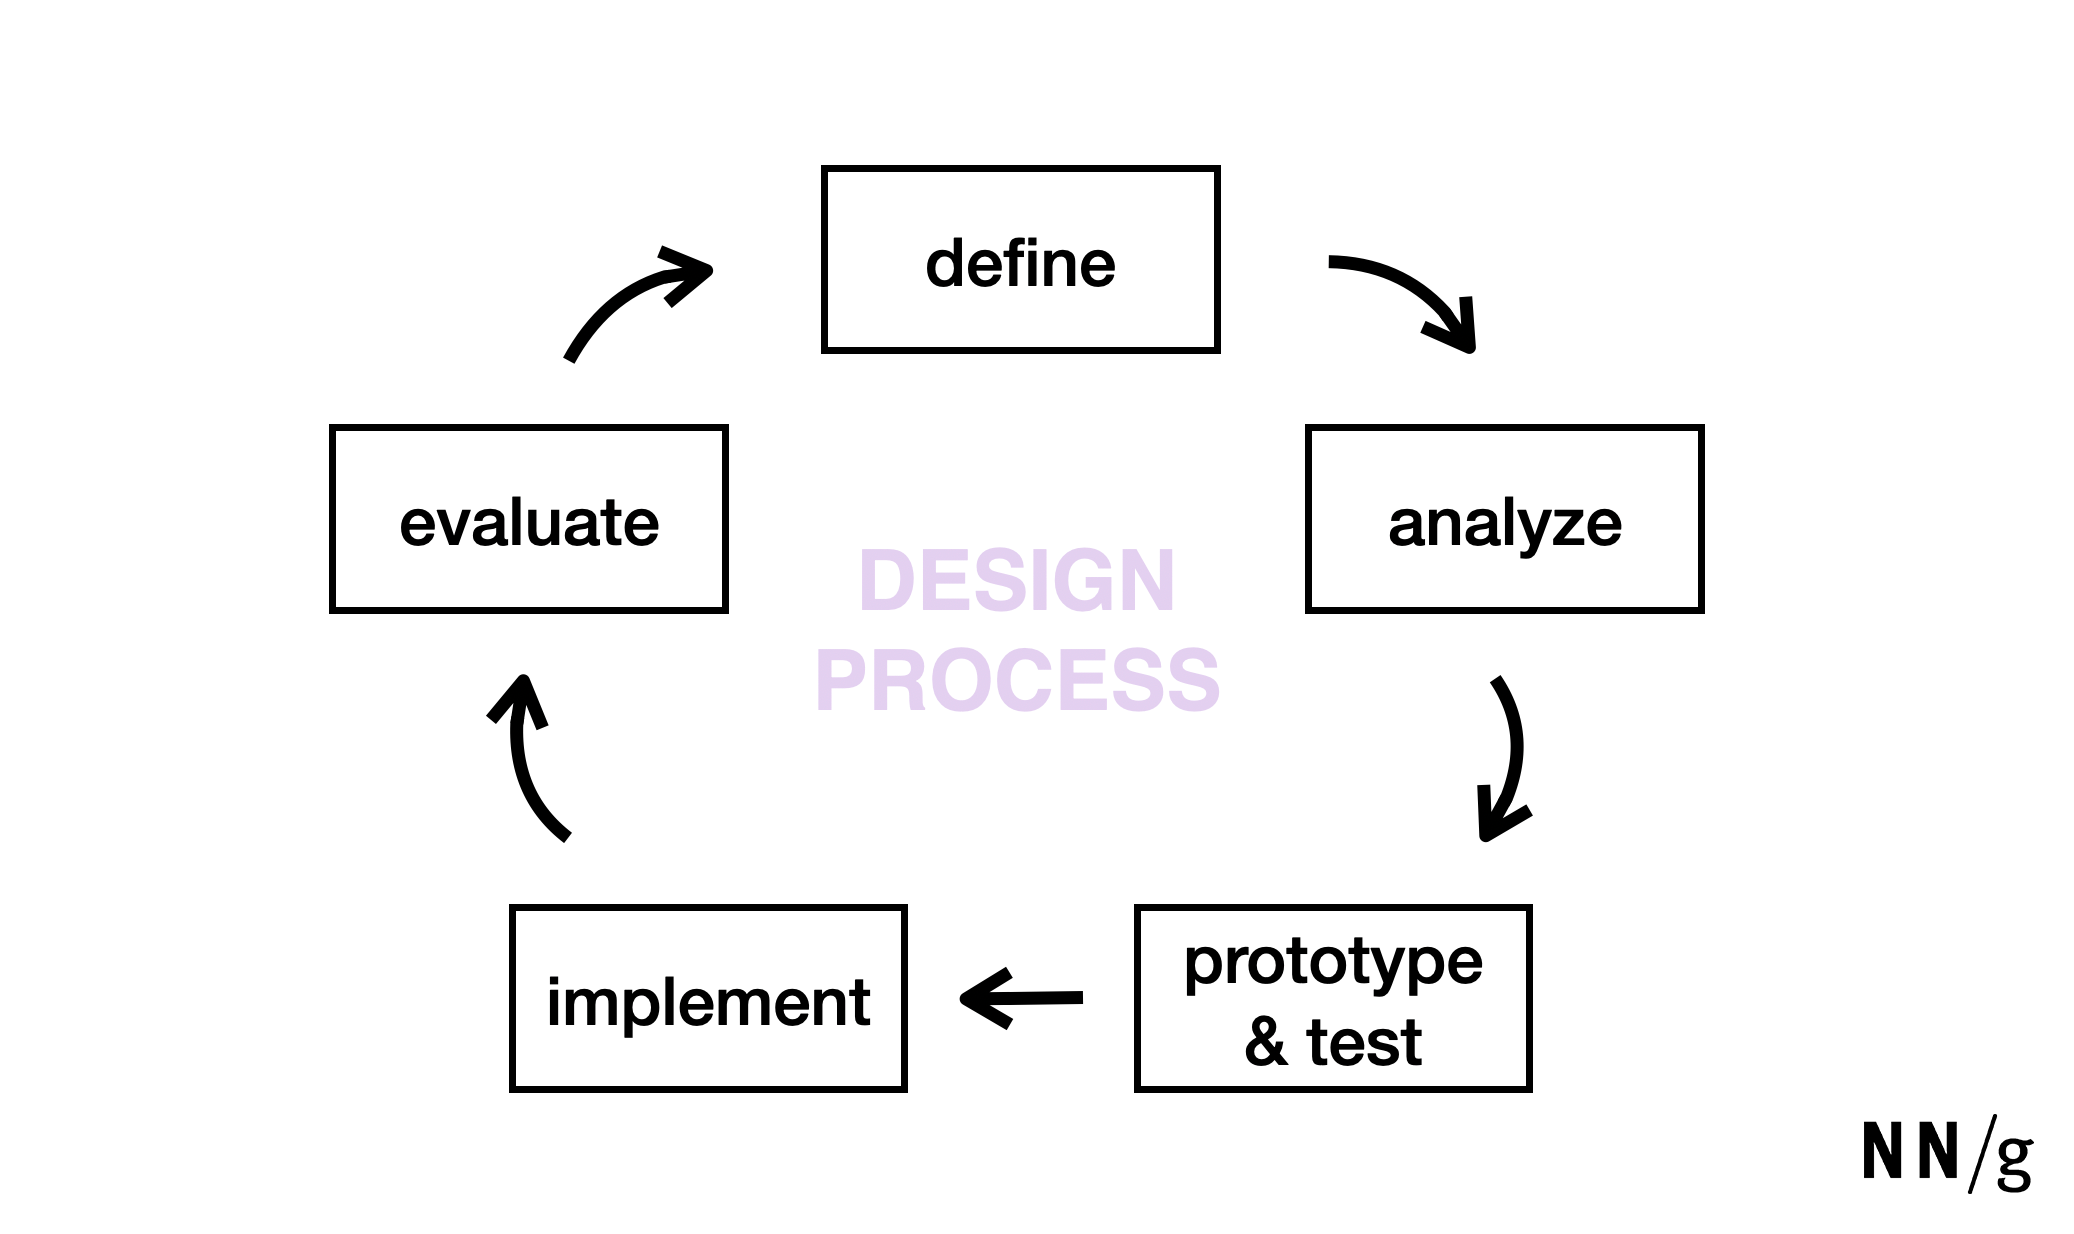
You might be familiar with a type of UX research that helps us learn what works or doesn’t work about a design and figure out how to fix those problems. That type of research is called formative evaluation — it helps us decide how to form or shape the design. Qualitative interviews and usability testing are frequently used for this purpose.
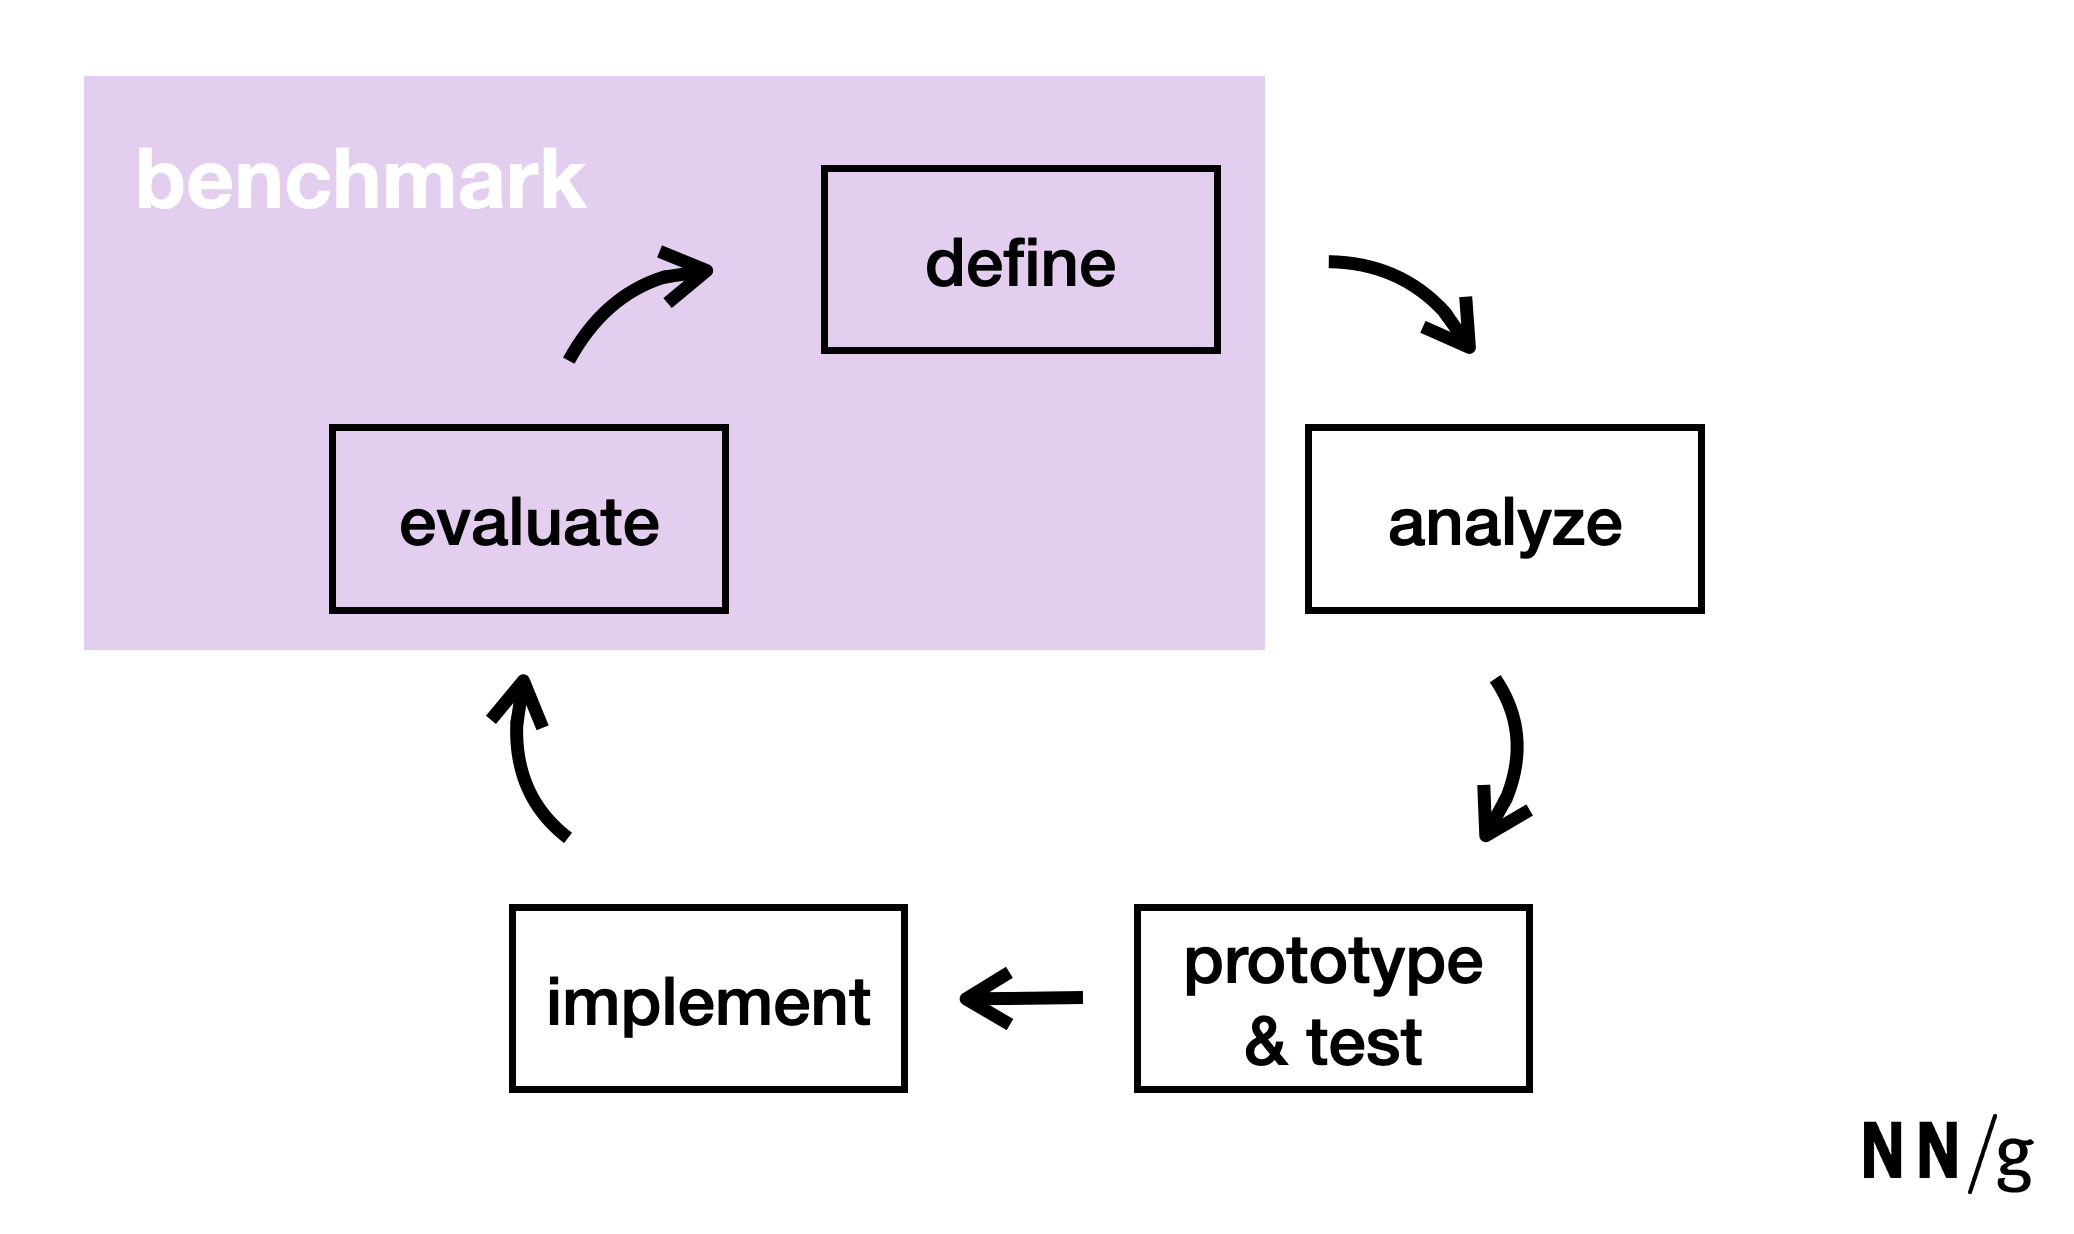
Benchmarking is not formative; it is a summative evaluation: in other words, it helps us assess the overall performance of a (sort of) complete design (a summary of its performance). Our designs are never really complete, we’re always improving them. But you can think of a benchmarking study as a kind of snapshot in time, capturing the experience of a specific version of the product or service. Benchmarking can happen at the end of one design cycle and before the next cycle begins.
It’s up to your team to decide how often you conduct benchmarking studies. Their frequency may also depend on the methodologies you’re using. Quantitative usability testing can be very expensive and time-intensive, so maybe you’ll decide to perform a benchmarking study once per year. Analytics can be much quicker for collecting benchmarking metrics, so maybe you’ll benchmark after each major product redesign.
Why Benchmark
Benchmarking allows us to assess our impact and improvement. It’s helpful for reflecting on our process and design choices. There’s a lot of value that benchmarking can provide to product or service teams.
But benchmarking’s real power comes in when you show those results externally, for example, to stakeholders or clients. You can demonstrate the impact of your UX work in a concrete, unambiguous way. And you can even take that a step further by using those metrics to calculate return on investment (ROI) — show stakeholders and clients exactly how much more they’re getting in return for what they paid. That way, you’ll have no problem arguing for more funding and bigger projects in the future.
For guidance and hands-on practice creating your own UX-benchmarking plan, check out our full-day course, Measuring UX and ROI.
For help analyzing and interpreting quantitative data, check our full-day course, How to Interpret UX Numbers: Statistics for UX.


Share this article: