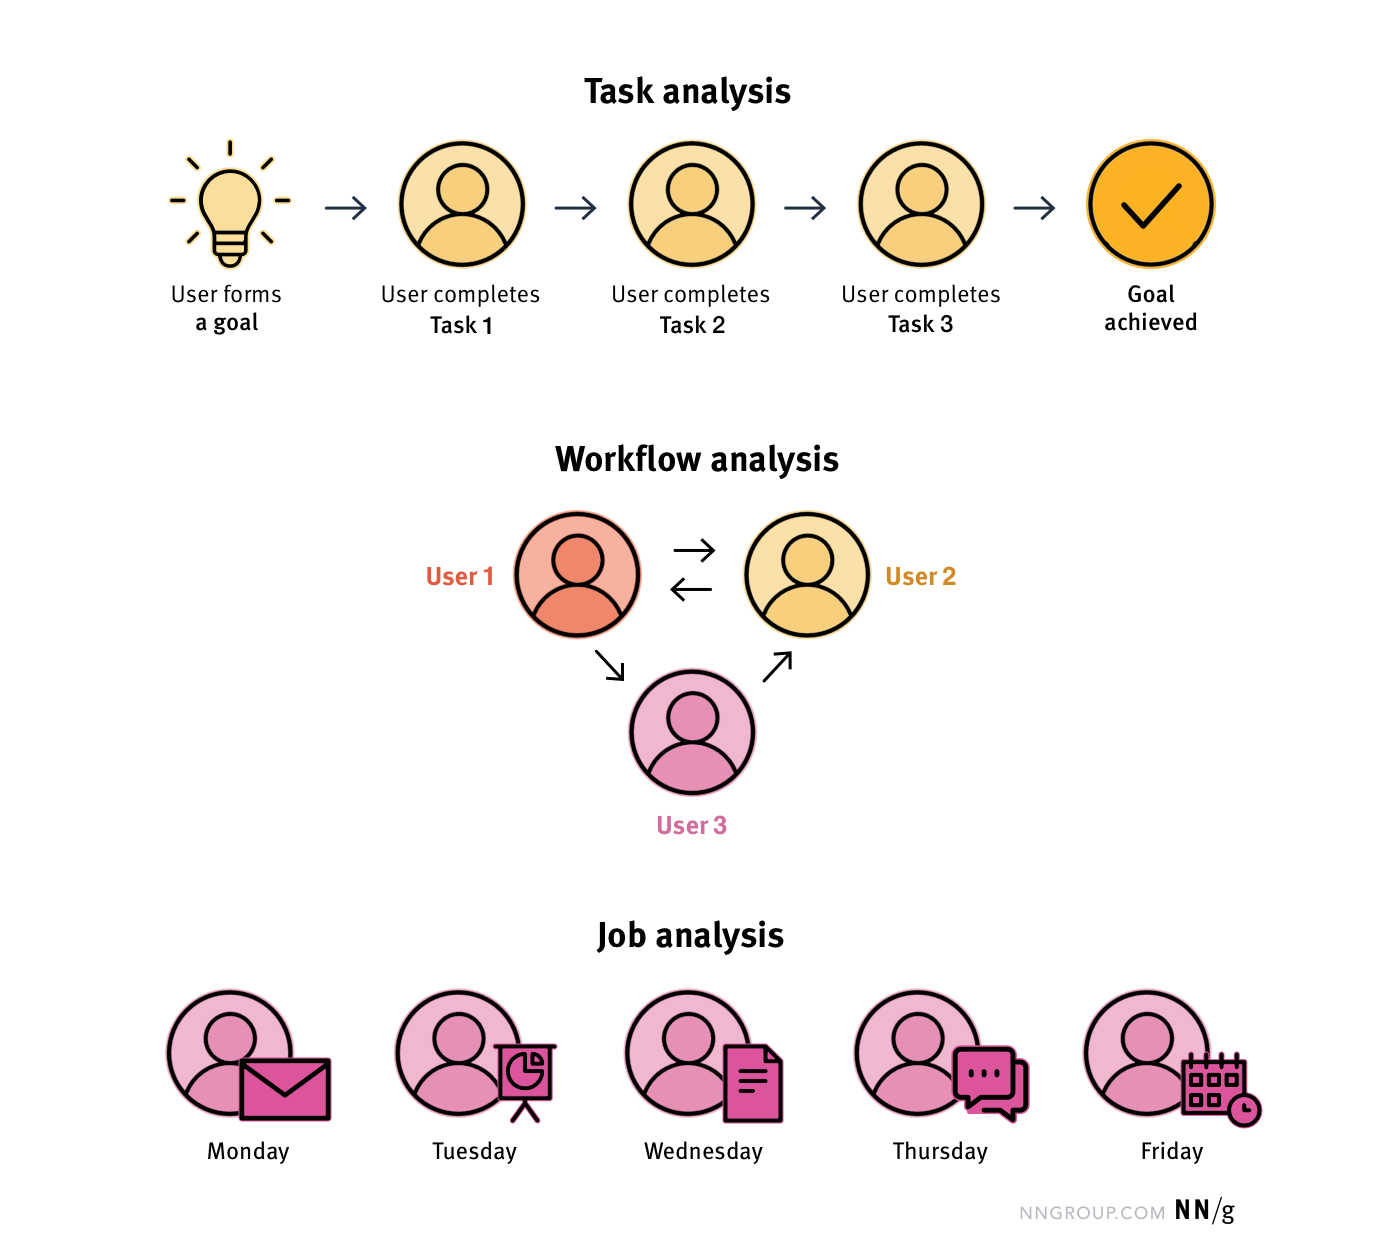
Task analysis refers to the broad practice of learning about how users work (i.e., the tasks they perform) to achieve their goals. Task analysis emerged out of instructional design (the design of training) and human factors and ergonomics (understanding how people use systems in order to improve safety, comfort, and productivity). Task analysis is crucial for user experience, because a design that solves the wrong problem (i.e., doesn’t support users’ tasks) will fail, no matter how good its UI.
In the realm of task analysis, a task refers to any activity that is usually observable and has a start and an end point. For example, if the goal is to set up a retirement fund, then the user might have to search for good deals, speak to a financial advisor, and fill in an application form — all of which are tasks. It’s important not to confuse goals with tasks. For instance, a user’s goal isn’t to fill in a form. Rather, a user might complete a form to register for a service they want to use (which would be the goal).
Task analysis is slightly different from job analysis (what an employee does in her role across a certain period of time — such as a week, month, or year) or workflow analysis (how work gets done across multiple people). In task analysis, the focus is on one user, her goal, and how she carries out tasks in order to achieve it. Thus, even though the name “task analysis” may suggest that the analysis is of just one task, task analysis may address multiple tasks, all in service of the same goal.

Studying users, their goals, and their tasks, is an important part of the design process. When designers perform task analysis, they are well equipped to create products and services that work how users expect and that help users achieve their goals easily and efficiently. Task analysis, as a method, provides a systematic way to approach this learning process. It can be flexibly applied to both existing designs (e.g., the use of an enterprise system) and system-agnostic processes (e.g., shopping for groceries).
The task-analysis process can be viewed as two discrete stages:
Stage 1: Gather information on goals and tasks by observing and speaking with users and/or subject-matter experts.
Stage 2: Analyze the tasks performed to achieve goals to understand the overall number of tasks and subtasks, their sequence, their hierarchy, and their complexity. The analyst typically produces diagrams to document this analysis.
Stage 1: Gather Information
In stage 1, typically, a combination of methods is used to learn about user goals and tasks. They include:
- Contextual inquiry: The task analyst visits the user onsite and conducts a semistructured interview to understand the user’s role, typical activities, and the various tools and processes used and followed. Then the analyst watches the user work. After a period of observation, the user is asked questions about what the analyst observed.
- Interviews using the critical incident technique: Users are asked to recall critical incidents, and the interviewer asks many followup questions to gather specific details about what happened. The stories provide detail on the tasks performed, the user’s goals, and where problems lie.
- Record keeping: Users are asked to keep records or diary entries of the tasks they perform over a certain period of time. Additionally, tracking software can be used for monitoring user activity.
- Activity sampling: Users are watched or recorded for a certain period of time in order to document which tasks are being performed, as well as their duration and frequency.
- Simulations: The task analyst walks through the steps that a user might take using a given system.
When carrying out research, do not rely solely on self-reported behavior (i.e., through interviews or surveys) or simulations (remember: you are not the user!), but also observe the user at work in her own context. Otherwise, you could miss out on important nuances or details.
Stage 2: Analyze Tasks
In stage 2, the task analyst will structure the observations by certain attributes like order, hierarchy, frequency, or even cognitive demands, to analyze the complexity of the process users follow in order to achieve their goals. The result of this analysis is often a graphical representation called a task-analysis diagram.
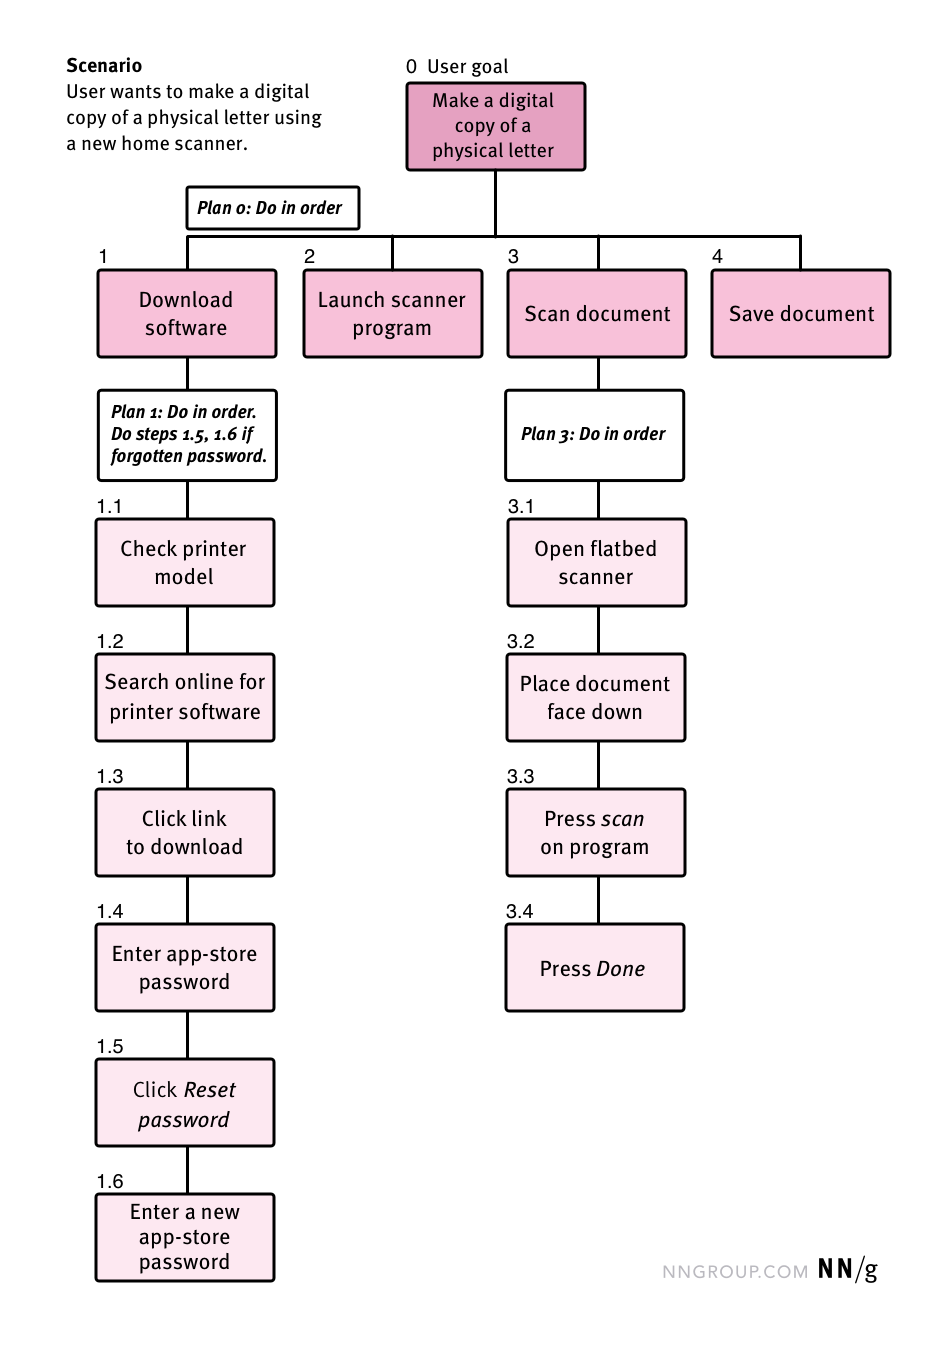
There are many different types of diagrams that could be produced, such as standard flowcharts or operational-sequence diagrams. However, the most commonly known and used in task analysis is the hierarchical task-analysis diagram (HTA). The figure below shows an example of an HTA for the goal of creating a digital copy of a physical letter using a new home scanner.

An HTA diagram starts with a goal and scenario (in the same way that a customer-journey map does) and highlights the major tasks to be completed in order to achieve it. In human factors, these tasks are referred to as ‘operations’. Each of the tasks in the top layer can be broken down into subtasks. The number of levels of subtasks depends on the complexity of the process and how granular the analyst wants the analysis to be.
Not all users accomplish goals in the same way. For example, a novice user might perform more tasks than an expert user — the latter might skip certain steps. The HTA enables these differences to be captured through ‘plans’. A plan specifies, at each level, what the order of the steps is, and which steps might be undertaken when or by whom. For example, a user who can’t remember his password has to undertake steps 1.5 (Click Reset password) and 1.6 (Enter a new app-store password) in order to accomplish the goal of downloading software for the scanner.
While a task-analysis diagram is useful to illustrate the overall steps in a process and is an excellent communication tool — especially for complex systems — it can also be used as a starting point for further analyses. For example, the following attributes could be considered for the tasks in an HTA.
- The overall number of tasks: Are there too many? Perhaps there are opportunities to create a design that could streamline the process and remove some steps.
- The frequency of tasks: How often are certain tasks performed? Are some tasks filled with repetition?
- The cognitive complexity of the tasks: What mental processes (i.e., thoughts, judgments, and decisions) are needed to complete a given task? (A whole branch of task analysis known as cognitive task analysis is concerned with these questions and with making visible the mental schemas and processes). If there are a lot of mental operations involved, the difficulty of the overall task increases, and the analyst should consider the likelihood of user error.
- The physical requirements of the task: What does the user need to physically do? Could this physical requirement affect user performance and comfort? And how could these physical requirements affect users with disabilities?
- The time taken to perform each task: Activity sampling or theoretical modeling (such as GOMS) can be used to estimate how long tasks would take users to complete.
At the end of the task analysis, the analyst has a good understanding of all the different tasks users may perform to achieve their goals and the nature of those tasks. Armed with this knowledge, the analyst can design (or redesign) an efficient, intuitive, and easy-to-use product or service.
Summary
Task analysis is a systematic method of studying the tasks users perform in order to reach their goals. The method begins with research to collect tasks and goals, followed by a systematic review of the tasks observed. A task-analysis diagram or an HTA is often the product of task analysis; the HTA can be used to communicate to others the process users follow, as well as a starting point for further assessment.
References
Hackos, J. A. T., & Redish, J. (1998). User and task analysis for interface design. New York: Wiley.
Kirwan, B. (Ed.), Ainsworth, L. (Ed.). (1992). A guide to task analysis. London: CRC Press, https://doi.org/10.1201/b16826
Stanton, N. A. (January 01, 2006). Hierarchical task analysis: Developments, applications, and extensions. Applied Ergonomics, 37, 1, 55-79. https://doi.org/10.1016/j.apergo.2005.06.003.


Share this article: