Many UX professionals gravitate towards qualitative (qual) methodologies, which are widely perceived as being easier and cheaper than quantitative (quant) research. They shy away from the intimidating prospect of larger sample sizes and statistics associated with quant.
If that sounds like you, you’re missing out! Quant methodologies are an important part of any experienced UX researcher’s toolkit. Quant methods allow you to:
- Put a number on the usability of your product. Numbers are sometimes more persuasive than findings and videos from qual testing (particularly when you’re trying to convince folks like executives).
- Compare different designs (for example, your new version vs. your old version, or your product vs. your competitor’s product), and determine whether the differences you observe are statistically significant, and not due to random chance.
- Improve UX trade-off decisions. For example, if a proposed design improvement is expected to be expensive to implement, is it worth doing? If you have an estimate of how much the change will improve the usability, a quant method may help you decide whether the redesign is worth it.
- Tie UX improvements back to organizational goals and key performance indicators (thus demonstrating your return on investment and justifying your UX team’s existence).
This article can help you get started — the first step is determining which quant UX research method you need. We’ll cover some of the most popular types of quant research:
- Quantitative Usability Testing (Benchmarking)
- Web Analytics (or App Analytics)
- A/B Testing or Multivariate Testing
- Card Sorting
- Tree Testing
- Surveys or Questionnaires
- Clustering Qualitative Comments
- Desirability Studies
- Eyetracking Testing
Each of these methods yields valuable quantitative data, but the techniques vary widely in the type of data collected, as well as the amount of resources and effort required.
This article lists the most common use cases for these methods, and estimates cost and difficulty for each. As with any research method, each of these can be adapted to fit a variety of needs. Depending on your specific circumstances, your costs and difficulty may be different from our rough estimates. Additionally, you should be aware that each of these methods will require different minimum sample sizes to determine statistical significance.
Quantitative Usability Testing (Benchmarking)
- Use:
- Tracking usability over time
- Comparing with competitors
- Cost: Medium
- Difficulty of Collection: Medium
- Difficulty of Analysis: Medium
- Type of Method: Behavioral (what people do)
- Context of Use: Task-based
Although not used as often, quantitative usability testing (sometimes referred to as usability benchmarking) is a lot like qualitative usability testing — users are asked to perform realistic tasks using a product. The primary difference between the two is that qual usability testing prioritizes observations, like identifying usability issues. In contrast, quant usability testing is focused on collecting metrics like time on task or success.
Once you’ve collected those metrics with a relatively large sample size (around 35 participants or more), you can use them to track the progress of your product’s usability over time, or compare it to the usability of your competitors’ products.

The type of usability testing you choose (in-person, remote moderated, or remote unmoderated) will impact the cost and difficultly associated with this method. Since the goals of quant and qual usability studies are different, the structure of the test and the tasks used will need to be different as well.
For all the skills you need to run a basic quantitative usability-testing study, see our full-day course Measuring User Experience.
Web Analytics (or App Analytics)
- Uses:
- Detecting or prioritizing problems
- Monitoring performance
- Cost: Low
- Difficulty of Collection: Low
- Difficulty of Analysis: High
- Type of Method: Behavioral (what people do)
- Context of Use: Live
Analytics data describe what people are doing with your live product — where they go, what they click on, what features they use, where they come from, and on which pages they decide to leave the site or app. This information can support a wide variety of UX activities. In particular, it can help you monitor the performance of various content, UIs, or features in your product, and identify what doesn’t work.
For an explanation of the differences between analytics and quant usability testing, watch this 2-minute video.
For more on analytics with a special focus on how these methods fit within UX, see our full-day course Analytics and User Experience.
A/B Testing or Multivariate Testing
- Use: Comparing two design options
- Cost: Low
- Difficulty of Collection: Low
- Difficulty of Analysis: Low
- Type of Method: Behavioral (what people do)
- Context of Use: Live
While you can use analytics metrics to monitor your product’s performance (as described above), you can also create experiments that detect how different UI designs change those metrics — either through A/B testing or multivariate testing.
In A/B testing, teams create two different live versions of the same UI, and then show each version to different users to see which version performs best. For example, you might create two versions of the same call-to-action button label: Get Pricing vs. Learn More. Then you could track the number of clicks that the button receives in the two versions. Multivariate testing is similar, but involves testing several design elements at once (for example, the test could involve different button labels, typography, and placement on the page.)
Both of these analytics-based experiments are great for deciding among different variations of the same design — and can put an end to team disputes about which version is best.

A major downside to this methodology is that it’s often abused. Some teams fail to run the tests as long as they should, and make risky decisions based on small numbers.
For more on A/B and multivariate testing for UX, see our full-day course Analytics and User Experience.
Card Sorting
- Use: Determining information-architecture labels and structures
- Cost: Low
- Difficulty of Collection: Low
- Difficulty of Analysis: Medium
- Type of Method: Attitudinal (what people say)
- Context of Use: Not using product
In a card-sorting study, participants are given content items (sometimes literally written on index cards) and asked to group and label those items in a way that makes sense to them. This test can either be conducted in person, using physical cards, or remotely using a card-sorting platform like OptimalSort.
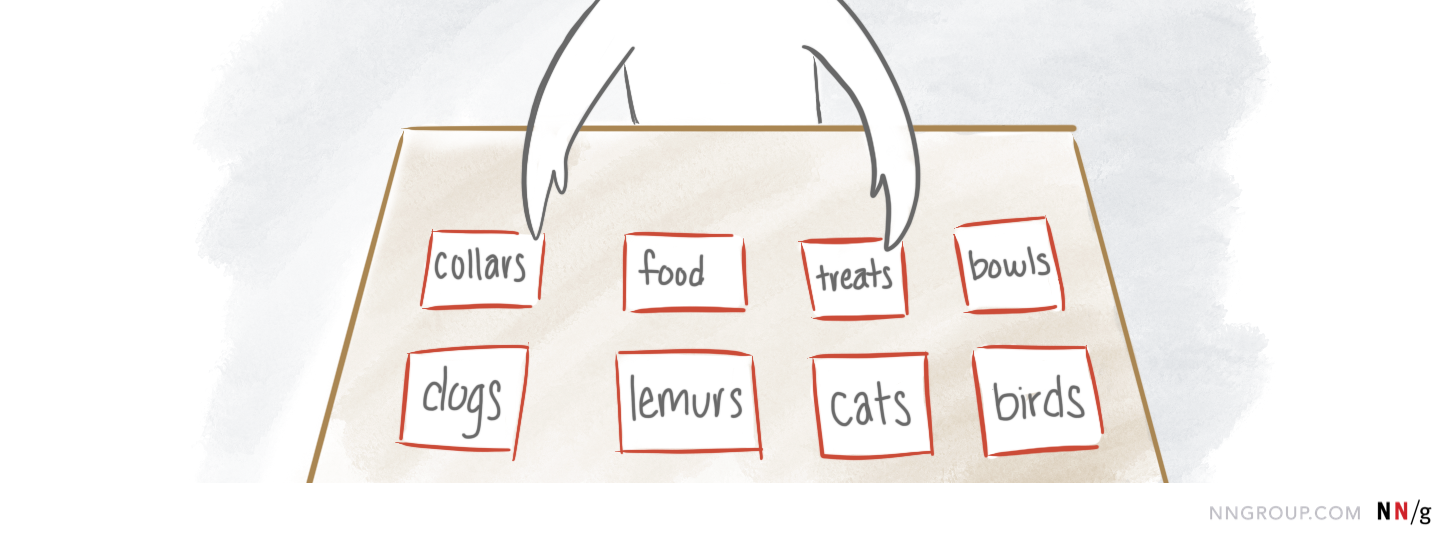
This method gives you the opportunity to get into users’ mental models of the information space. What terminology do they use? How do they logically group these concepts together?
Quantitative analysis of the percentage of participants who created similar groupings can help establish which categorization approach would be understandable to most users.
Tree Testing
- Use: Evaluating information-architecture hierarchies
- Cost: Low
- Difficulty of Collection: Low
- Difficulty of Analysis: Medium
- Type of Method: Behavioral (what people do)
- Context of Use: Task-based, not using product
In a tree test, participants attempt to complete tasks using only the category structure of your site. It’s essentially a way to evaluate your information architecture, by isolating it away from all other aspects of your UI.
For example, imagine your product is a pet-supplies website, and this is your top-level hierarchy.
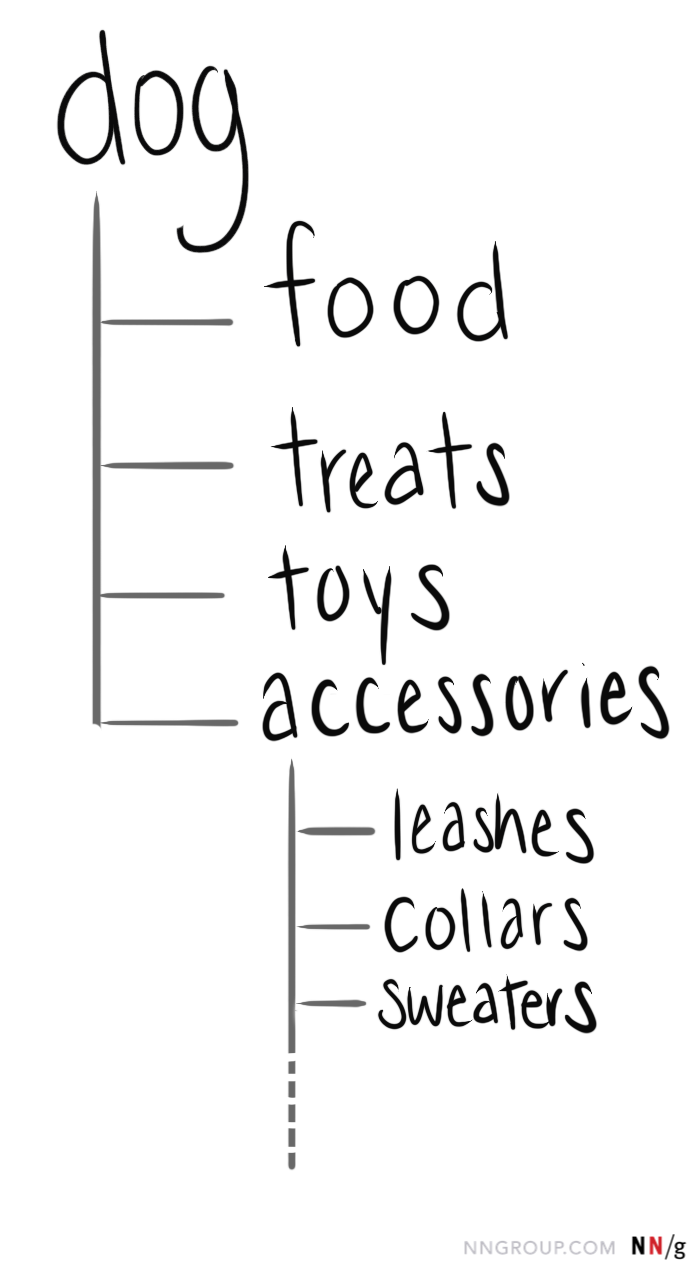
You might ask your participants in one task to find the dog collars. Quantitative analysis of the tree-test results will show whether people were able to find the right path to this item in the information hierarchy. How many participants picked the wrong category?
This method is useful in identifying if an IA structure, labels, and placements agree with people’s expectations.
For more information about how to design and evaluate information architecture, see our full-day course Information Architecture.
Surveys and Questionnaires
- Use: Gather information about your users, their attitudes, and behaviors
- Cost: Low
- Difficulty of Collection: Low
- Difficulty of Analysis: Low
- Type of Method: Attitudinal (what people say)
- Context of Use: Any
Surveys are a flexible user-research tool. You can administer them in a variety of contexts — as short intercept surveys on a live website, in emails, or after a usability test.
They can produce combination of quantitative and qualitative data — ratings, proportions of answers for each choice in a multiple-choice question, as well as open-ended responses. You can even turn qualitative responses to a survey into numerical data (see the following section on coding qualitative comments).
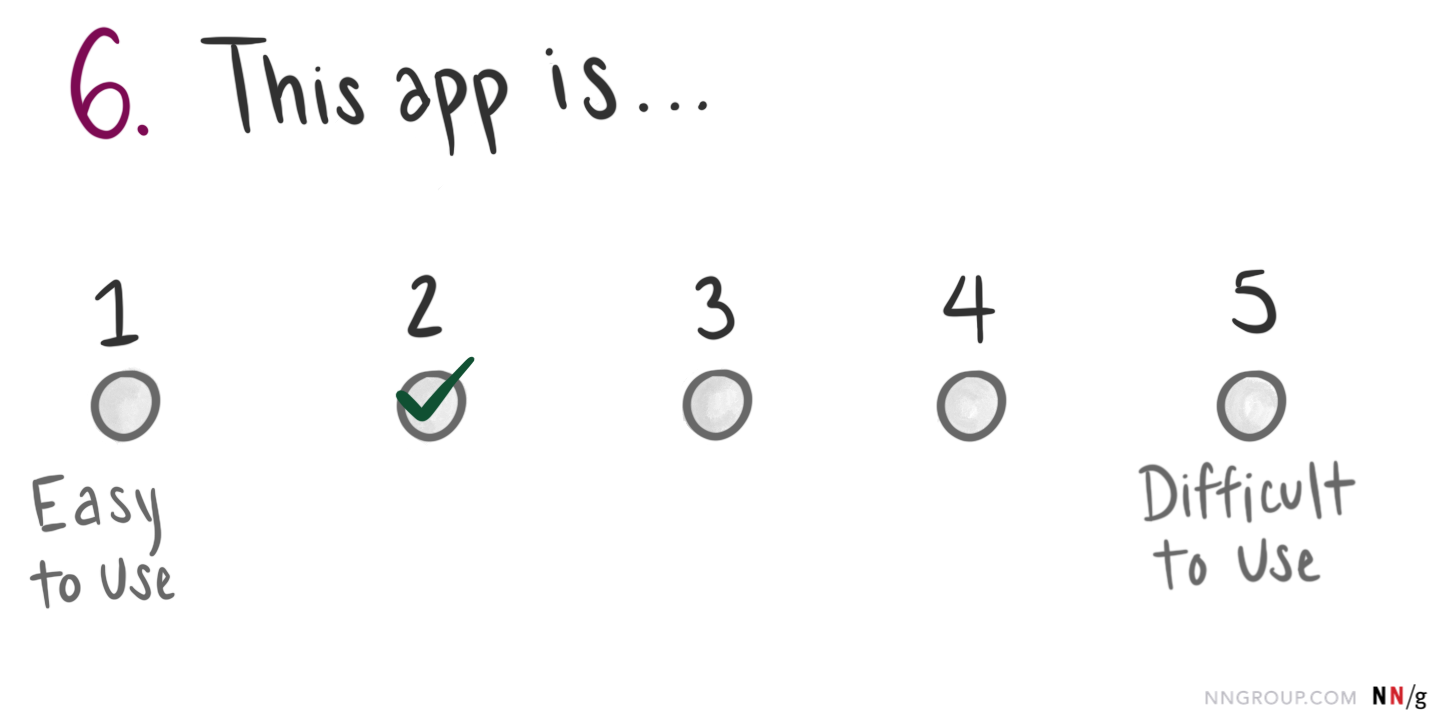
You can create your own custom surveys, or you can use one of the many established questionnaires available (for example, the System Usability Scale or Net Promoter Score). An advantage of one of those questionnaires is that you can often compare your result to industry or competitor scores, to see how you’re doing. Even if you create your own custom questionnaire, you can still track your average scores over time, to monitor product improvements.
For more on designing surveys, as well as many qualitative user research methods, see our full-day course User Research Methods: From Strategy to Requirements to Design.
Clustering Qualitative Data
- Use: Identifying important themes in qualitative data
- Cost: Low
- Difficulty of Collection: Medium
- Difficulty of Analysis: Medium
- Type of Method: Attitudinal (what people say)
- Context of Use: Any
This technique is less of a data-collection methodology, and more of an analysis approach for qualitative data. It involves grouping observations from a qualitative study (for example, a diary study, survey, focus group, or interviews) based on common themes. If you have a lot of observations, you can count the number of instances when a particular theme is mentioned.
For example, imagine you run a diary study asking participants to report every time they use your product in their daily lives for a week, with the goal of understanding in what context they use your products. You may count the instances when people used the product at work, in their homes, or on the go.
This method can identify the prevalence or frequency of a specific theme or situation — for example, the frequency of a user complaint or of a UI problem.
This approach is a good way to mine numerical data from large amounts of qualitative information, but it can be quite time consuming.
Desirability Studies
- Use: Identifying attributes associated to your product or brand
- Cost: Low
- Difficulty of Collection: Low
- Difficulty of Analysis: Low
- Type of Method: Attitudinal (what people say)
- Context of Use: Task-based
Quantitative desirability studies attempt to quantify and measure some quality of a product — such as aesthetic appeal, brand strength, tone of voice. These studies can be customized depending on your research questions, but they generally involve first exposing participants to your product (either by showing them a still image or by asking them to use the live product or a prototype). Then you’ll ask them to describe the design by selecting options from a list of descriptive words. With a large sample size that is representative of your population, trends start to emerge. For example, you may that 84% of respondents describe the design as “fresh.”
Eyetracking Testing
- Use: Determining which UI elements are distracting, findable, or discoverable
- Cost: High
- Difficulty of Collection: High
- Difficulty of Analysis: High
- Type of Method: Behavioral (what people do)
- Context of Use: Task-based
Eyetracking studies require special equipment that tracks users’ eyes as they move across an interface. When many participants (30 or more) perform the same task on the same interface, meaningful trends start to emerge and you can tell, with some reliability, which elements of the page will attract people’s attention. Eyetracking can help you identify which interface and content elements need to be emphasized or deemphasized, to enable users to reach their goals.
A major obstacle to running eyetracking studies is the highly specialized, prohibitively expensive, and somewhat unstable equipment that requires lots of training to use.
If you’re considering running an eyetracking study, check out our free report on How to Conduct Eyetracking Studies.
Choosing a Method
|
Method |
Typically Used for |
Cost |
Difficulty of Collection |
Difficulty of Analysis |
Type |
Context of Use |
|
Quantitative Usability Testing |
Tracking usability over time Comparing competitors |
Medium |
Medium |
Medium |
Behavioral |
Task-Based |
|
Web Analytics (or App Analytics) |
Detecting or prioritizing problems Monitoring performance |
Low |
Low |
High |
Behavioral |
Live |
|
A/B Testing |
Comparing two specific design options |
Low |
Low |
Low |
Behavioral |
Live |
|
Card Sorting |
Determining IA labels and structures |
Low |
Low |
Medium |
Attitudinal |
Not Using Product |
|
Tree Testing |
Evaluating IA hierarchies |
Low |
Low |
Medium |
Behavioral |
Not Using Product |
|
Surveys and Questionnaires |
Gather information about your users, their attitudes, and behaviors |
Low |
Low |
Low |
Attitudinal |
Any |
|
Clustering Qualitative Comments |
Identifying important themes in qualitative data |
Low |
Medium |
Medium |
Attitudinal |
Any |
|
Desirability Studies |
Identifying attributes associated to your product or brand |
Low |
Low |
Low |
Attitudinal |
Task-Based |
|
Eyetracking Testing |
Determining which UI elements are distracting, findable, or discoverable |
High |
High |
High |
Behavioral |
Task-Based |
This table provides a summary of the methods discussed above.
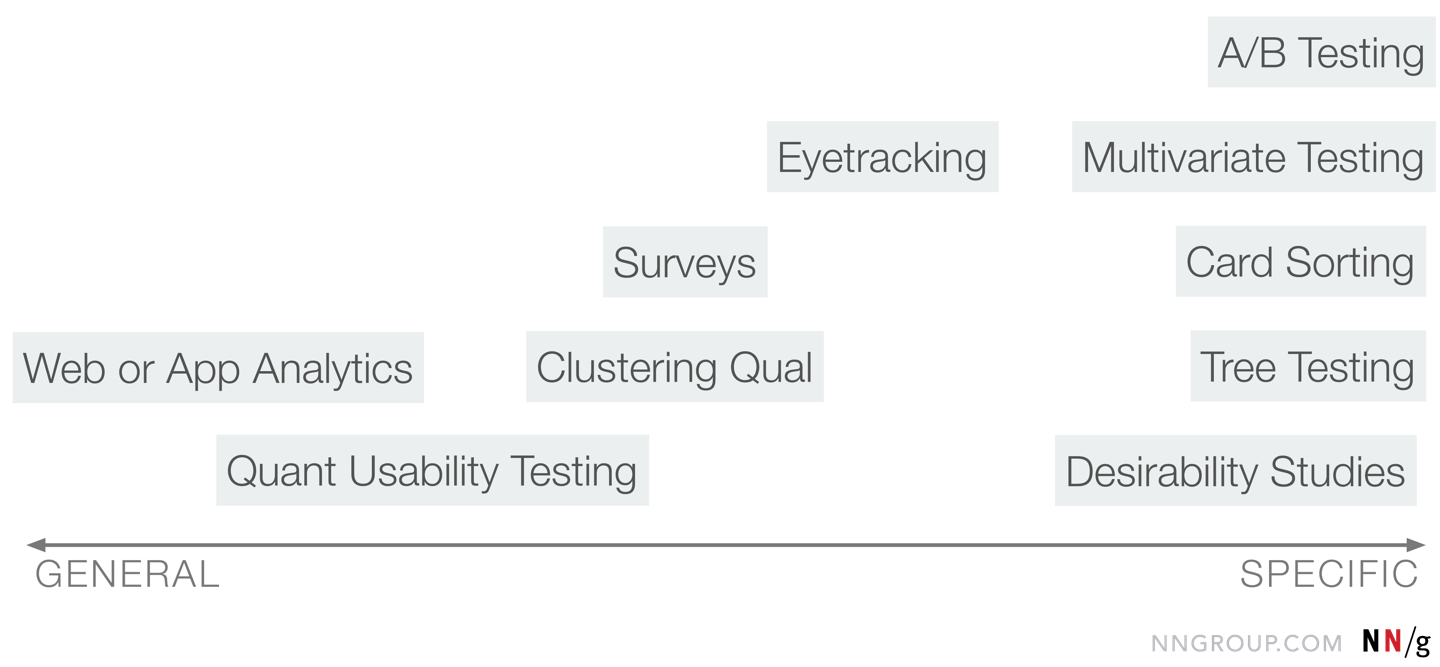
Start with Your Research Question
When trying to determine which quant method to use, lead with your research question. What do you need to know? Some of these methodologies are best suited to very general research questions. For example:
- How did our product usability change over time?
- How are we doing compared to our competitor?
- Which of our problems have the biggest impact? How should we prioritize?
For these types of questions, you’ll likely want to use quant usability testing, web analytics, or surveys.
Other methodologies work well when you have a more specific question you want to answer. For example:
- How should we fix our global-navigation categories?
- What do most of our users think about our visual design?
- Which of these two design alternatives should we use for the dashboard?
For these research questions, you’ll probably want to use A/B testing, card sorting, tree testing, coding qualitative comments, desirability studies, or eyetracking.
There are some grey areas within those recommendations, however. For example, an A/B test may not be an option for your company, for security or technical reasons. If that’s the case, and you can afford it, you could do an in-person quant usability study to compare two prototypes. However, that isn’t the typical use for quant usability testing, so I did not discuss it here.
Consider the Cost
After the research question, the second most influential factor in choosing a methodology is cost. These methodologies will vary a lot in cost depending on how your implement the study. The tools you use, the number of participants you have, and the amount of time spent by your researchers will all impact the final cost. To make this even more complicated, many teams have widely different research budgets. Again, the cost estimates here are relative.
Lower-budget teams will rely on digital methods — remote usability testing, online card-sorting platforms like OptimalSort, A/B testing, and web or app analytics. As a rule of thumb, the in-person methodologies (such as in-person usability testing, in-person card sorts) tend to be more expensive because they require so much more of researcher’s time. Additionally, they can require travel and equipment rentals. Eyetracking is the most expensive methodology listed here, and should be employed only by teams with big budgets and research questions that warrant using it.
Next Steps
Once you’ve selected a method, learn about it! Do your homework to make sure you’ll be able to plan and conduct the study the way you’d like to, and to ensure you’ll get useful results. I’ve included links throughout this article to point you towards more resources for each method, as well as a Resourcessection at the end.
Be warned: You can’t just collect metrics and start making decisions without doing any statistical analysis. It isn’t enough to just collect rating-scale responses from 5 users, take an average, and move on.
For each method discussed here, there are different recommended minimum sample sizes — the number of data points you’ll likely need to collect in order to have reliable data and determine statistical significance. You’ll need to hit those minimum sample sizes. If you don’t, you have no assurance that your findings aren’t just a fluke.
Be sure to factor in the time you’ll need to research relevant statistical concepts for whichever method you select, as well as the cost of obtaining the correct minimum sample size. I promise, it isn’t quite as hard as it looks, and your quant data will be well worth the trouble.
Resources
Measuring UX and ROI (Full-day course)
“Understanding Statistical Significance” (Article)
“What Does Statistically Significant Mean?” (Article)
“Quantitative Studies: How Many Users to Test?” (Article)
“How to Compute a Confidence Interval in 5 Easy Steps” (Article)
“Return on Investment for Usability” (Article)
Return on Investment (ROI) for Usability, 4th Edition (Report)
“When to Use Which User-Experience Research Methods” (Article)
“UX Research Cheat Sheet” (Article)
Measuring U’s sample size and confidence interval calculators (Tool)
Quantitative Usability Testing
“Quantitative vs. Qualitative Usability Testing” (Article)
“Accuracy vs. Insights in Quantitative Usability” (Article)
“Writing Tasks for Quantitative and Qualitative Usability Studies” (Article)
“Remote Usability Tests: Moderated and Unmoderated” (Article)
“Remote Moderated Usability Tests: How and Why to Do Them” (Article)
“Success Rate: The Simplest Usability Metric” (Article)
Analytics
Analytics and User Experience (Full-day course)
“Analytics vs. Quantitative Usability Testing” (Video)
“Three Uses for Analytics in User-Experience Practice” (Article)
“Five Essential Analytics Reports for UX Strategists” (Article)
A/B Testing or Multivariate Testing
Analytics and User Experience (Full-day course)
“Putting A/B Testing in Its Place” (Article)
“Define Stronger A/B Test Variations Through UX Research” (Article)
“10 Things to Know About A/B Testing” (Article)
“Multivariate vs. A/B Testing: Incremental vs. Radical Changes” (Article)
Card Sorting
Information Architecture (Full-day course)
“Card Sorting: Uncover Users’ Mental Models for Better Information Architecture” (Article)
“Card Sorting: Pushing Users Beyond Terminology Matches” (Article)
“Card Sorting: How to Best Organize Product Offerings” (Video)
“How to Avoid Bias in Card Sorting” (Video)
Tree Testing
Information Architecture (Full-day course)
“Tree Testing: Fast, Iterative Evaluation of Menu Labels and Categories” (Article)
“Tree Testing Part 2: Interpreting the Results” (Article)
“Using Tree-Testing to Test Information Architecture” (Article)
Surveys and Questionnaires
User Research Methods: From Strategy to Requirements to Design (Full-day course)
“12 Tips for Writing Better Survey Questions”(Article)
“Cleaning Data from Surveys and Online Research” (Article)
Clustering Qualitative Data
“5 Examples of Quantifying Qualitative Data” (Article)
“How to Code and Analyze Verbatim Comments” (Article)
“Diary Studies: Understanding Long-Term User Behavior and Experiences” (Article)
Desirability Studies
“Desirability Studies: Measuring Aesthetic Response to Visual Design” (Article)
“Using the Microsoft Desirability Toolkit to Test Visual Appeal” (Article)
“Microsoft Desirability Toolkit Product Reaction Words” (Article)
Eyetracking Testing
How to Conduct Eyetracking Studies (Free report)
“Eyetracking Shows How Task Scenarios Influence Where People Look” (Video)


Share this article: