We have long documented that advertising in online media carries a user-experience cost:
- Users find many online advertising techniques highly annoying — that attitude has remained constant since we first reported it in 2004.
- Because online ads are so irritating, users have evolved banner blindness as a defense mechanism to reduce this annoyance. (Also a finding that has remained true for decades, meaning that it’s not likely to change anytime soon.)
- Even worse (from a web-design perspective), ads poison the well for honest designers seeking to boost the visual design of useful page elements: anything with an overly fancy look may be unjustly taken for an ad and also ignored by users.
These three issues definitely worsen the user experience of using the Internet as a whole. Some sites are annoying, and even those sites that are not annoying will be used less efficiently because users have become so defensive in the face of the advertising barrage. I’m not even talking about the technical penalty imposed by ad blockers and other plugins that degrade the functionality of browsers. Or the impact of privacy violations driven by the business models of certain social media sites which may even be contributing to mental-health issues for some users.
Online advertising is bad for UX. Yet it persists because it drives revenue, and thus is good for business. But is that really true? We have long argued that the degradation of the user experience caused by too many ads can have an adverse impact on the business value of a website. Basically, if you annoy users too much, they’ll stop using the site, or at least visit it less.
(Conversely, there’s extensive evidence that better usability leads to increased use — and also to increased sales for those websites following ecommerce UX guidelines. If better UX equals more use, it seems reasonable to expect lower UX to decrease use.)
I have always believed in this argument, based on what we observe in user testing. But a usability study is only a one-hour slice of somebody’s life. Most generate qualitative insights that make it hard to quantify the loss of business caused by user annoyance. So I have not had hard proof. (We obviously have many quantitative user-research methods, but they’re rarely employed in a way that generates insight into the problem I’m discussing here.)
New Data: Streaming Music Case Study
An extremely thorough new research study from Pandora Music now allows us to quantify the business cost of annoying online advertising in a specific user experience: that of streaming music. The data is published in a paper by Jason Huang (Stanford University and Uber), David H. Reiley (Pandora Media Inc. and University of California at Berkeley), and Nickolai M. Riabov (Brown University and Netflix), which is referenced below.
The researchers studied 35 million users of the Pandora streaming music service during the period from June 2014 to March 2016. Because of the large sample size, all the findings in the study are statistically significant at the p < .01 level, and I won’t even bother discussing the statistical analyses, which you can find in the full paper.
- 18.3 million users were assigned to a control group who used the normal Pandora service with its normal amount of advertising: 3.6 ads per hours of listening.
- 1.8 million users were assigned to a low-ad group who were served 25% less advertising than the control group (2.7 ads per hour).
- 1.8 million users were assigned to a high-ad group who were served 38% more advertising than the control group (5.0 ads per hour).
- (13 million users were assigned to intermediate treatment groups that I will not discuss further.)
The results are clear, though not as striking as I would have expected: after 1.5 years of being exposed to the experimental conditions, people did use the service more, the fewer ads they were served. At the end of the experiment:
- The low-ad group listened for 1.7% more hours weekly than the control group.
- The high-ad group listened for 2.8% fewer hours weekly than the control group.
So, as expected, better user experience caused more use of the service, and degraded user experience caused less use.
There may seem to be a mismatch between the magnitude of the percentages: 38% more advertising only decreased use by 2.8%. This difference makes some sense once we realize that the biggest impact on the Pandora user experience is caused by the music, not the ads. The service plays songs people like, and the vast majority of listening time is spent listening to music, not to ads. Thus, 38% more advertising time corresponds only to a small percentage of the total listening time, in the form of slightly more than one additional short audio ad being served each hour. So, although a 2.8% decline in usage may seem a small price to pay for 38% more advertising, it is likely that the order of magnitude will be very different for other types of businesses.
Longitudinal Study Needed to Measure Full Effect of Degraded UX
From a methodology perspective, an exciting aspect of Huang et al.’s study is the longitudinal data collection over 18 months.
The following chart shows the month-by-month listening time for the two experimental groups, compared to the control group:
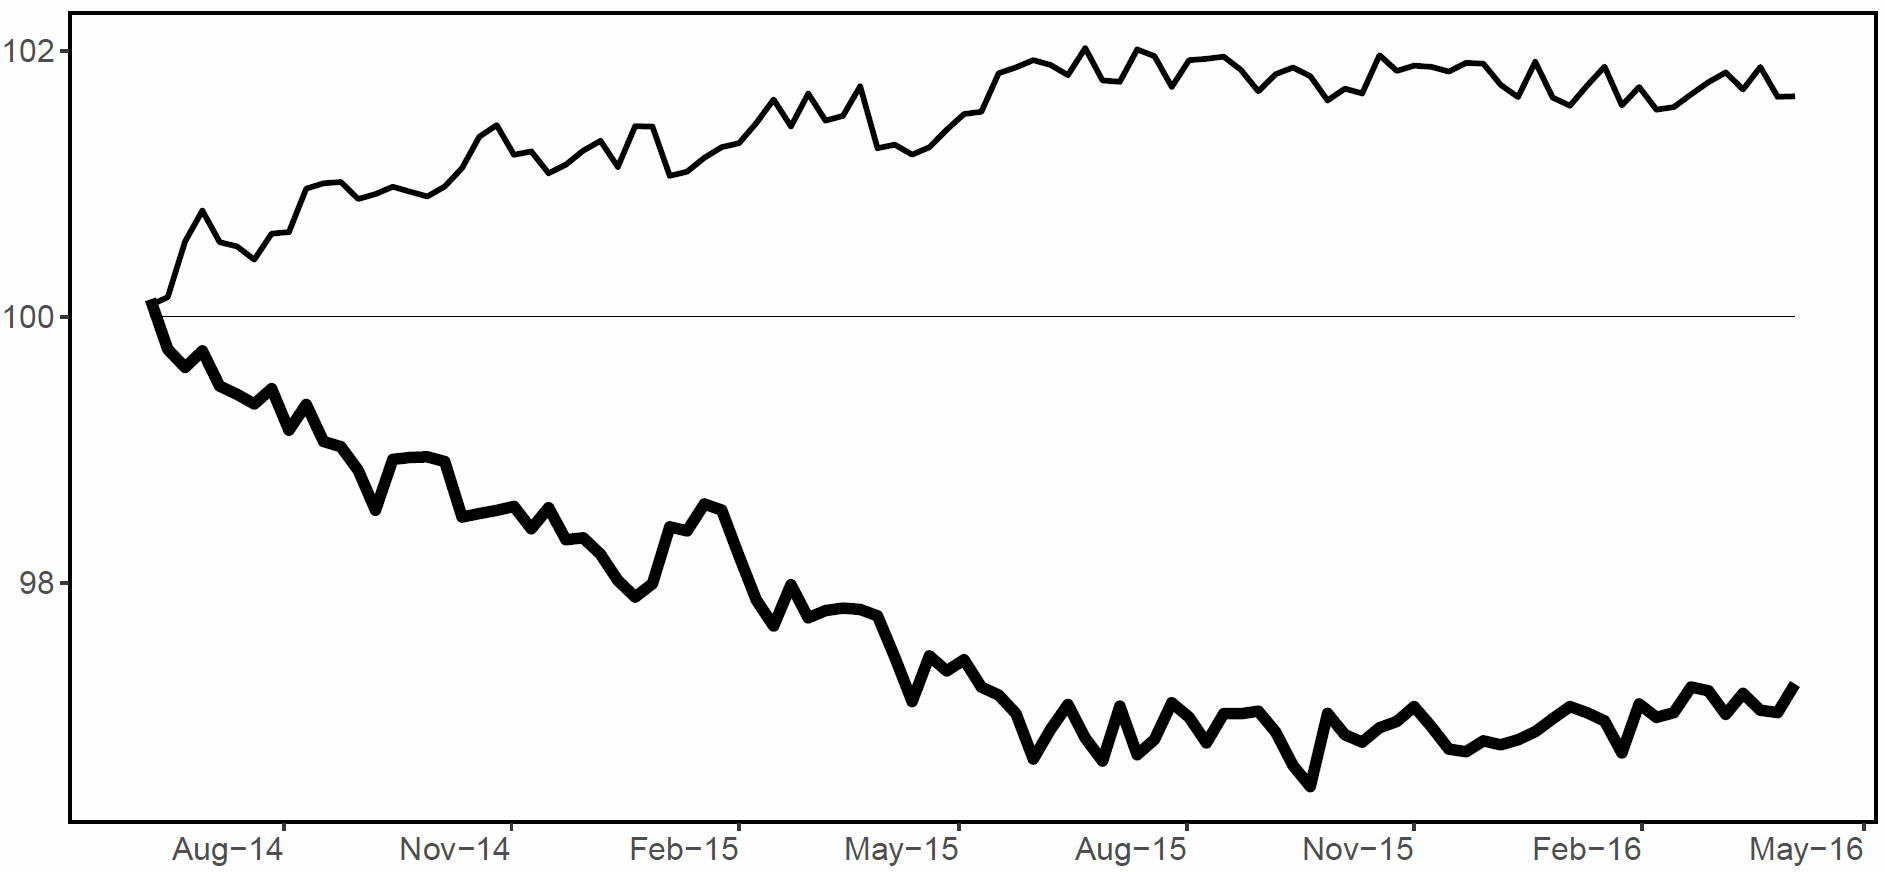
While, from month to month, there is some immediate effect of the change in advertising, it’s small. If we looked just at one month’s worth of data, we would conclude that increased advertising only lowered use by maybe 0.4%. This number might seem small enough to be a price worth paying, especially when compared with the vastly higher revenue achieved by selling 38% more ads.
(The revenue gain would be smaller than 38%, since the incremental ads would have to be sold at less attractive rates — plus, of course, there would be slightly fewer listening hours in which to run these ads.)
However, users in the high-ad group listen less and less, as they continue to experience the higher advertising load and it’s only after a full year’s exposure to the degraded user experience that use seems to flatten out.
The full-year change in user behavior (2.8% less use) is 7 times bigger than the one-month change (0.4% less use).
Given the huge N (22 million users total across the 3 main study conditions), simplistic analytics based on one month of data would no doubt have concluded that increasing the number of ads had a highly statistically significant effect with a very narrow margin of error. However, because users’ behavior continues to change with additional exposure, this analysis would have been wrong. This is why proper use of website analytics requires insights into the user-experience implications of the design conditions that are being tested.
User Loyalty Degraded by Poor UX
The total amount of use (here: listening to streaming music) may be the best single indicator of the quality of the user experience. However, the researchers also measured a few other things, including user loyalty, which is the probability that a given person continues as an active user of the service.
They determined that user loyalty drops by 0.9% for each additional ad played per hour.
The change in user loyalty has a huge impact on the overall value of the service. The decrease in total number of listening hours can be broken down into two main factors, both contributing to various degrees:
- Drop in the number of active users (i.e., people who stopped using the service) accounted for 41% of the decrease in listening time. This is the effect of reduced loyalty.
- Decline in usage per active user (i.e., people who kept using the service, but used it less often or for a shorter duration when they listened) accounted for 59% of the decrease in listening time. This is the effect of increased annoyance for those users who stay loyal to the service.
Remember that the formula for website success is:
B = V × C × L
Where
- B = amount of business done by the site
- V = unique visitors coming to the site
- C = conversion rate (the percentage of visitors who become customers); note that the concept of conversion applies not only to ecommerce sites, but to any site where there is something you want users to do
- L = loyalty rate (the degree to which customers return to conduct repeat business)
Of these parameters, V has traditionally been the focus of Internet marketing: let’s drive more traffic to the site. C was the traditional focus of web UX professionals: let’s make the design better, so that we capture more value from each visitor. L was often neglected, but this new case study clearly shows that user experience can have a strong influence on user loyalty, and not just on the conversion rate during the current visit.
Conclusion
The Pandora case study has three clear takeaways for Internet user-experience practice:
- The data clearly documents that degraded user experience leads to less use and lower customer loyalty.
- Specifically, exposing users to more annoying advertising will make them leave a service.
- Getting an accurate estimate of these effects requires a longitudinal study, since users continue to adapt their behavior with increased exposure to the changed design.
How well does this case study translate to more mainstream websites? We can’t know for sure, and more research will surely be welcome. I don’t expect that the exact findings will be directly transferrable, because this was a study of streaming media that’s being passively consumed, whereas mainstream web use is more highly interactive.
Autoplaying ads were the second-most hated format in our study of the annoyance of online advertising. (But note that we studied video ads, not the audio ads used by Pandora.) Thus, other ads may be less annoying and cause less loss of user loyalty and use. On the other hand, interactive use of a design is likely to be more impacted by annoyance, as the competition is famously only a click away and users surf the web with their hand on the mouse, ready to issue that site-killing click.
All we can say for sure, given the new data is: yes, annoying users has a direct cost in the form of lost business.
Reference
Jason Huang, David H. Reiley, and Nickolai M. Riabov (April 21, 2018): Measuring Consumer Sensitivity to Audio Advertising: A Field Experiment on Pandora Internet Radio. Available at https://davidreiley.com/papers/PandoraListenerDemandCurve.pdf (warning: PDF file).


Share this article: