Collecting metrics in usability studies has become a common practice. We routinely recommend that, whenever you report such a metric, you also include the corresponding confidence interval. But what is a confidence interval?
Let us take a short detour to understand what a confidence interval is. To do so, let’s start with an example from the news, which reports that in May 2021, according to a poll, 79% of people in Canada either have already had a COVID-19 vaccine or will take one as soon as it is available to them.
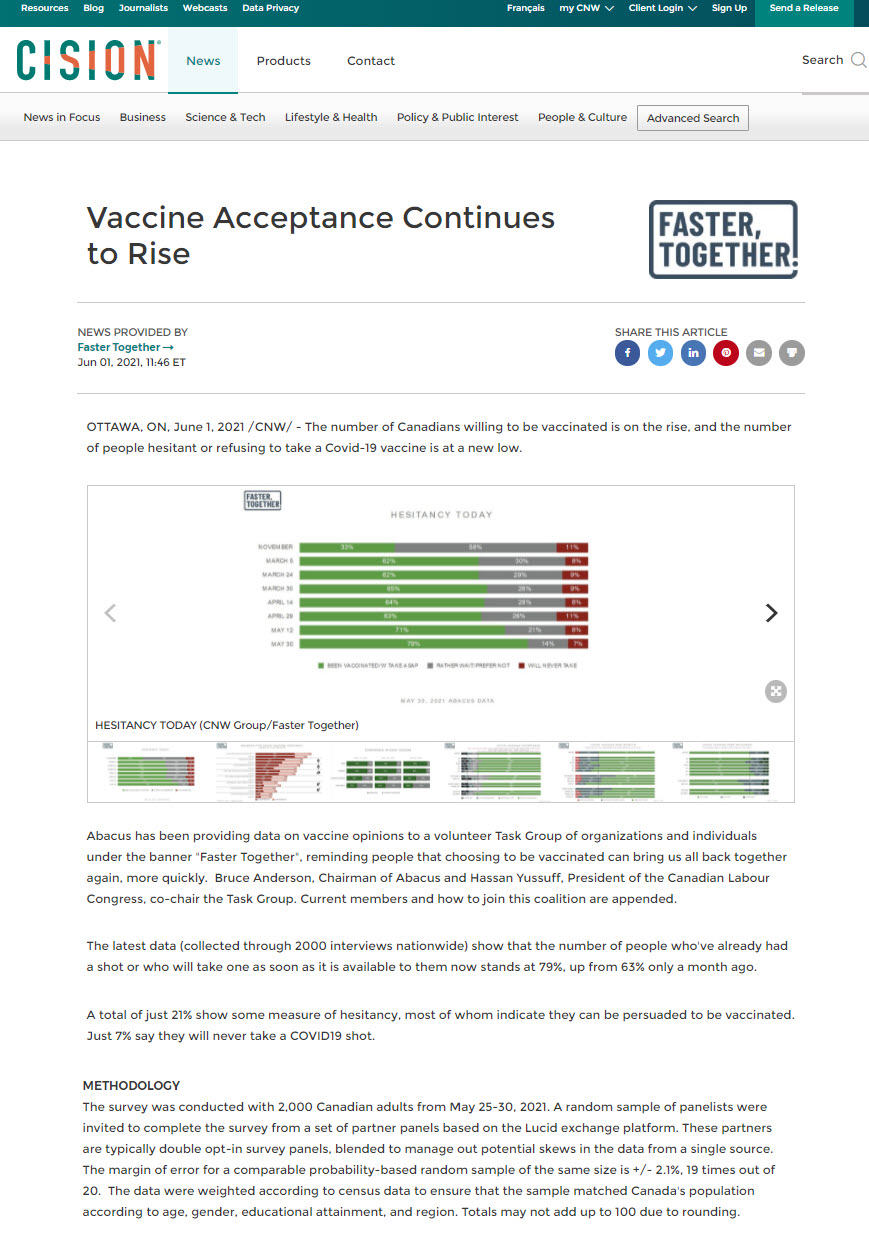
As you probably well know, the numbers presented in such articles are not based on interviewing the whole population (i.e., all Canadian adults) and getting an answer from every single qualifying person. Instead, they are based on a sample. In the news story above, the Methodology section reveals that the sample included 2000 Canadian adults and that the margin of error for a comparable probability-based random sample of the same size is +/- 2.1%, 19 times out of 20.
What does this sentence mean?
Confidence Interval and Margin of Error
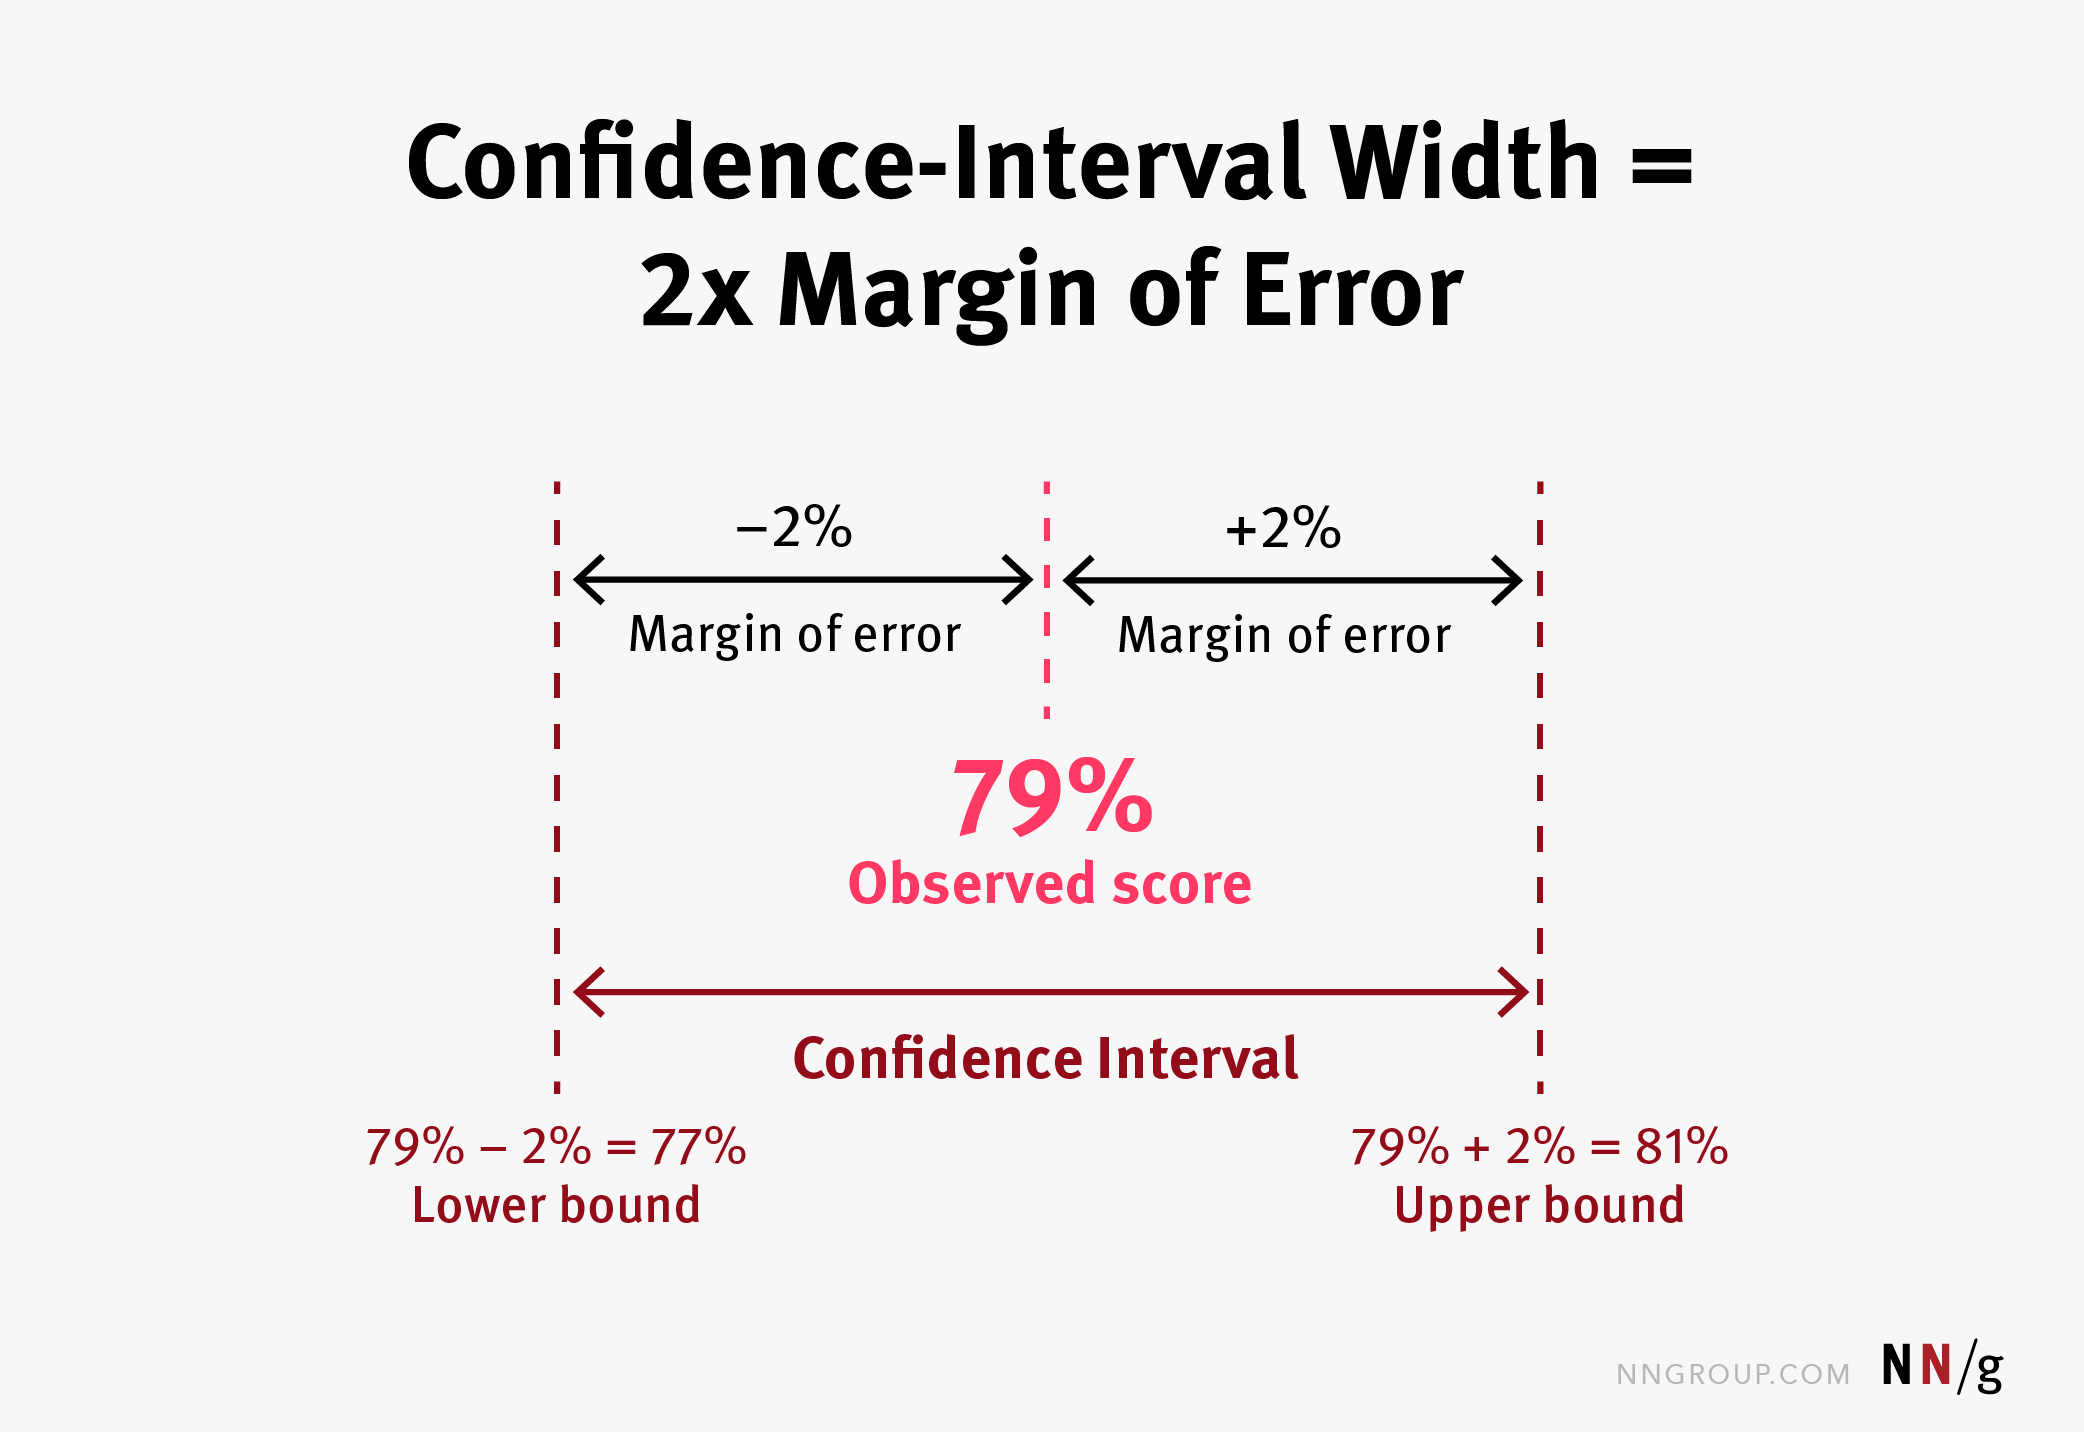
Even though you may have trouble understanding precisely some of the words in the sentence, you probably can guess what it means: that 79%+/-2% of the adult Canadians are vaccinated or willing to be so. We don’t know precisely whether the actual number is 78% or 81%, but we know that the number is somewhere in the range of 77% to 81%. That range is an example of a confidence interval.
Elsewhere, we explained the true-score theory; here’s a quick recap. For a given metric (be it success, time on task, number of errors, or, like in our example, whether someone is willing to get a vaccine), we are interested in a summary of that metric over the entire population. That is the so-called true score. Unfortunately, unless we have a very small target population, it’s not possible to measure everyone in it, so we cannot ever know the true score. Therefore, we estimate it by looking at a sample of our population. The assumption is that the number we get from the sample (the so-called observed score) will predict the true score — the behavior of our whole population. The margin of error and the confidence interval tell us how good our prediction is expected to be.
Definition: A confidence interval is the likely range for the true score of your entire population.
Note that the confidence interval and the margin of error convey (almost) the same information and usually only one of them is reported (like in the news story at the beginning of this article). If you have the margin of error and also an observed score (usually an average), you can easily compute the confidence interval. In fact, the width of the confidence interval is twice the margin of error.
Statistics is the discipline that helps us calculate confidence intervals. Depending on the type of metric that you’re tracking (e.g., success, time, satisfaction rate in UX), there will be slightly different methods to calculate confidence intervals.
In this article we will not go into the nitty-gritty of calculating confidence intervals. It’s rare that you will need to calculate a confidence interval by hand — statistical software or web calculators will do it for you. However, some basic understanding of what we want in a confidence interval and the factors that influence confidence intervals is important.
Narrower Confidence Intervals Are Better
Let’s say that in one of our quantitative usability studies, we get that the success rate for a given task is 40% and the confidence interval is between 0% and 80%. That kind of result is not very helpful, is it? The true success rate among our user population could be 10% or could be 79% — and those numbers would speak very differently about our UI. In contrast, if our confidence interval was between 35% and 45% for the same task, we would get a lot more information about the usability of our interface and how easy it is for people to complete the task.
In general, narrower confidence intervals carry more information. And when we are running quantitative studies, we’re always striving for narrow confidence intervals.
There are three factors that generally influence the size of the confidence interval:
- The size of your sample:
- The variability of your sample
- The confidence level: how much you can trust your confidence-interval calculation
The first factor, sample size (or how many people you include in your study), is why we generally do not recommend that you report numbers from small qualitative studies. The larger your sample size, the narrower your confidence interval. When there are just a few people in your study, your confidence interval will usually be large and your observed score will be a poor predictor of the behavior of your general population.
The variability of your sample can also affect confidence-interval size for continuous metrics like task time. If you have a task that could be completed in many different ways, some quick and some slow, and your users could take any of those paths, then your task times will be quite different from one user to the next and you may have difficulty obtaining a tight confidence interval even when you include many participants in your sample. In general, the more variability you have, the wider your confidence interval.
Let’s next talk about the last factor — confidence level.
Confidence Level
Very important in the definition of the confidence interval is the word “likely” — a confidence interval is the likely range for the true score of the entire population.
Confidence-interval calculations are probabilistic: that means that, even though the statistical methods to calculate a confidence interval generally will produce a range that will include your true score, there is no absolute guarantee that the calculation will be right all the time. There is a chance that your calculation will result in an interval which does not include your true score. The good news is that you can choose what that chance will be, and that is by selecting a confidence level.
The confidence level tells you how confident you can be that your calculation of a confidence interval will include the true score.
Different confidence levels translate in slightly different ways of calculating the confidence interval with different chances of including the true score. For example, if your confidence level is 95%, it means that 95% of the time, the corresponding confidence interval will include the true score. Or, in other words, if you were to run 100 studies and computed confidence intervals based on the observed scores from those studies, in 5 out of those 100 studies your confidence intervals would be wrong and would not actually contain the true score of your population. Or, if you were to run 20 studies, in 1 of them you may get a wrong result. (And in 19 of those cases your calculation would be correct — hence the last part of our example sentence the margin of error […] is +/- 2.1%, 19 times out of 20. It’s another way of saying that the confidence level used for the calculation of the margin of error was 95%.)
(And yes, saying “the confidence interval corresponding to the 95% confidence level” is a mouthful, so, instead, it is customary to refer to such an interval as the 95% confidence interval. Same with the other confidence levels.)
For scientific publications, the confidence level is always set to 95%. But in UX, it doesn’t need to always be that high. Sometimes you may be willing to assume a higher risk that your calculation is incorrect. It depends on what is at play. If you’re designing an interface for a plane dashboard, you probably want to have a high confidence in the success rate for landing the plane, so you’ll use a high confidence level. But if you’re simply trying to predict completion rate for a task that is not critical to your business (like, maybe, resetting the passengers’ video system on the same plane), a lower confidence level may be okay.
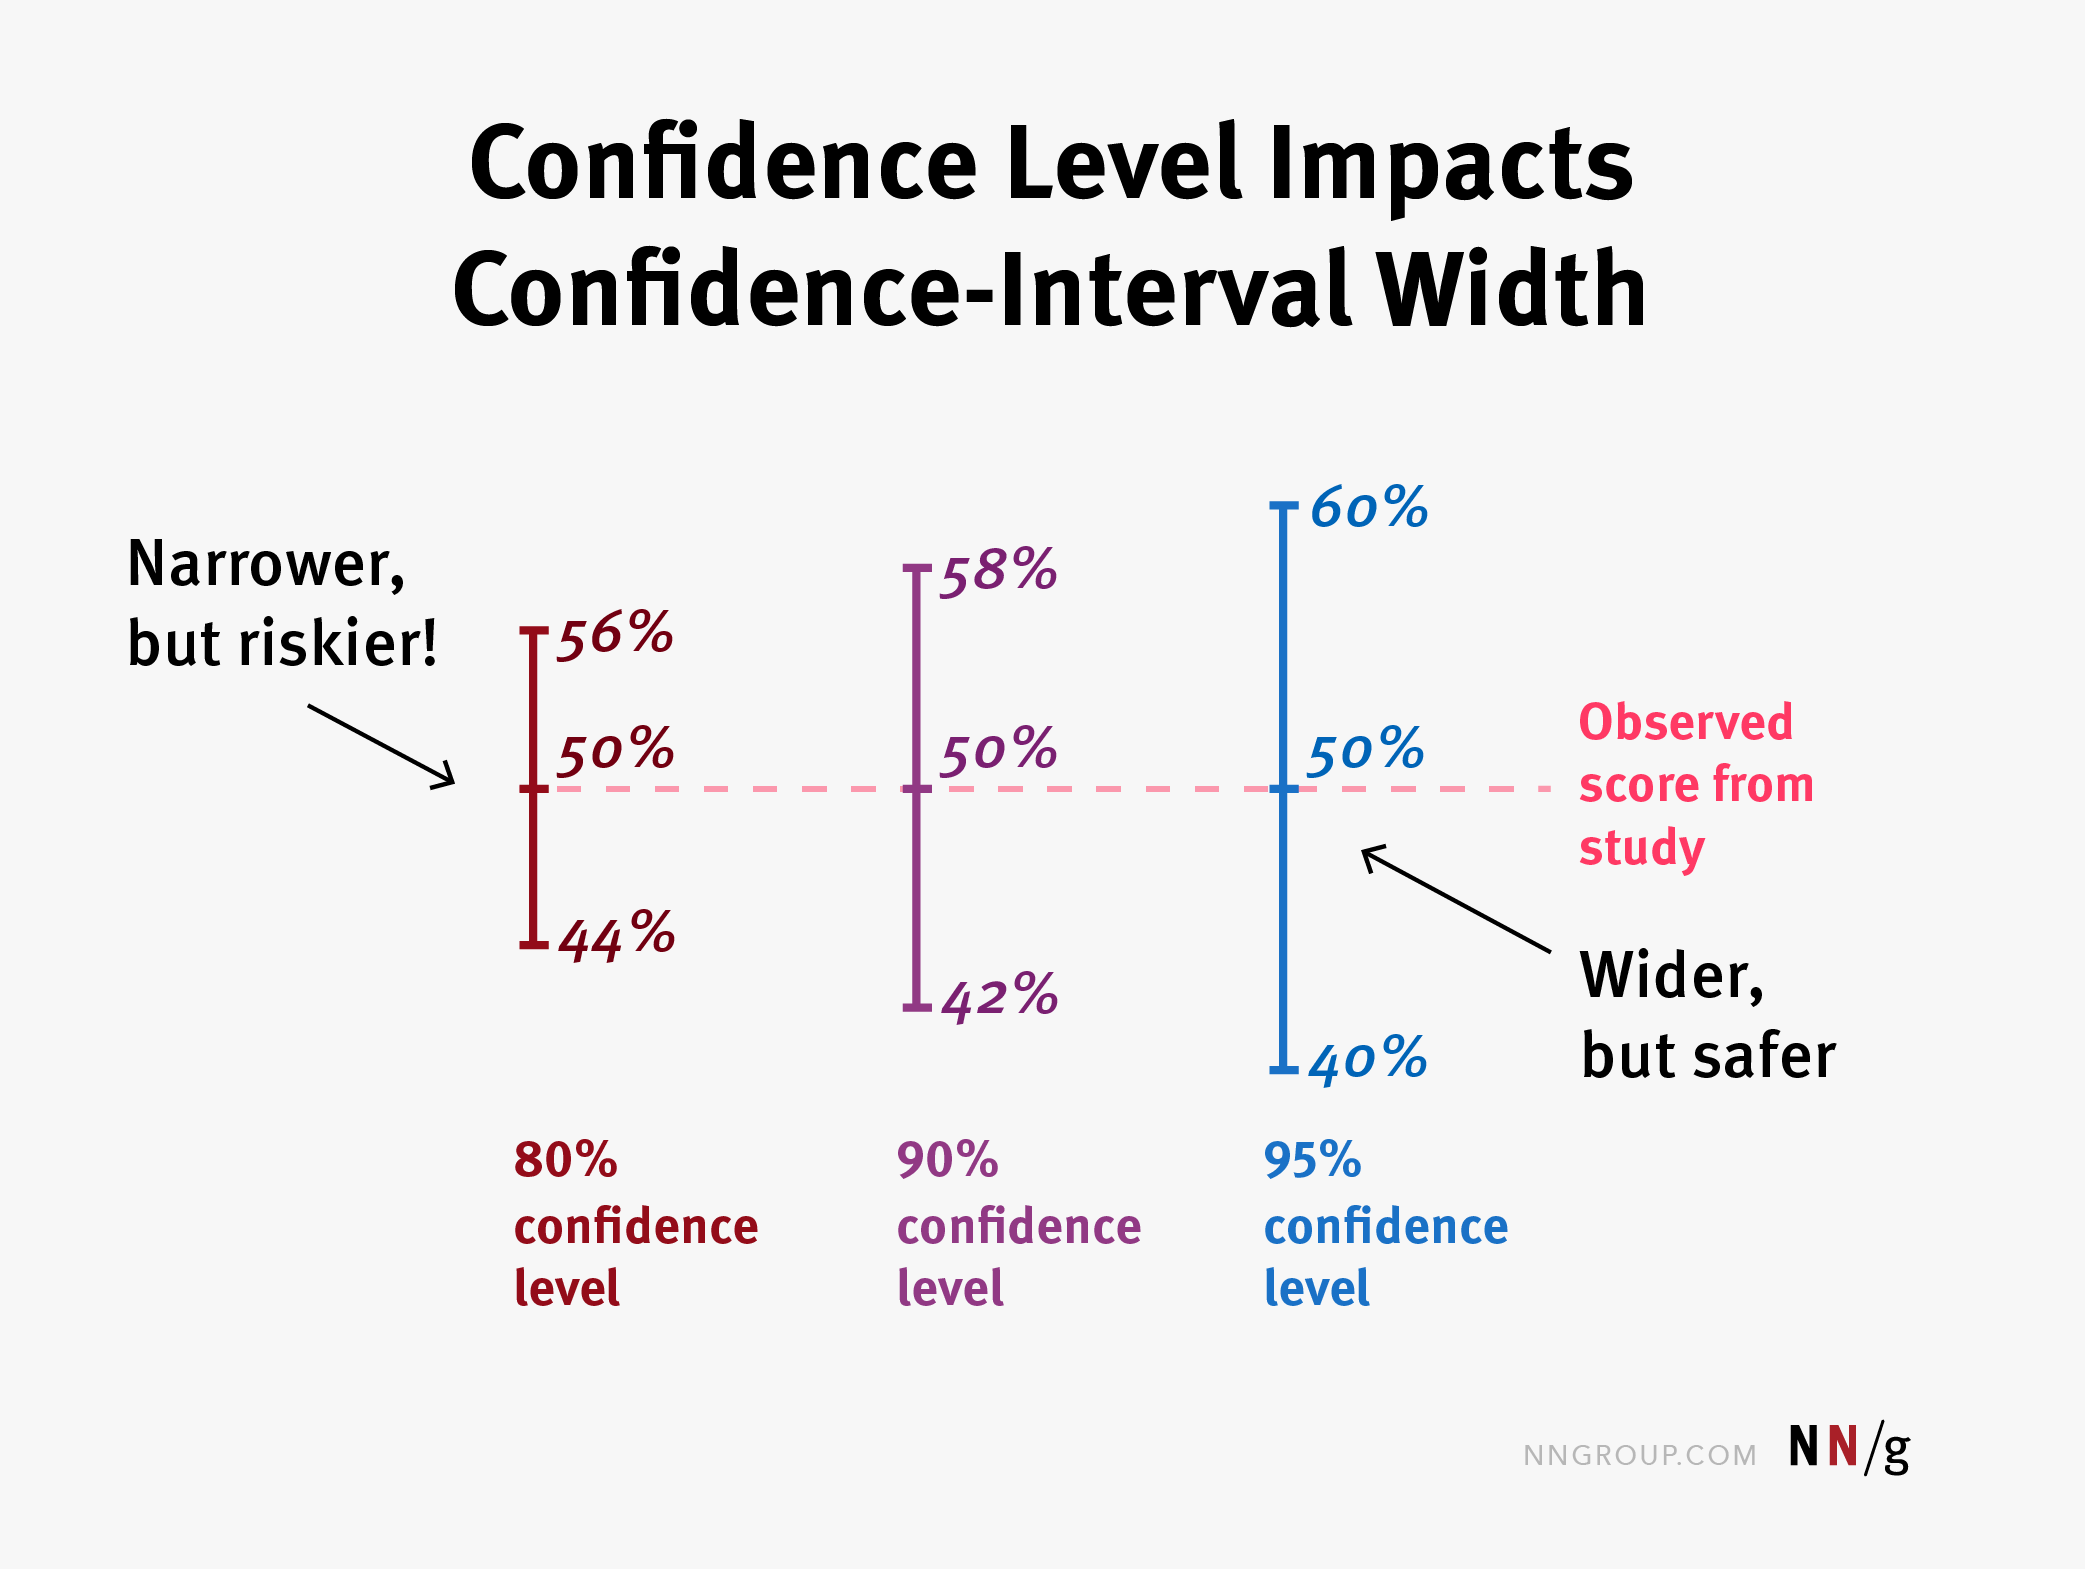
You may ask: why not always have a high confidence level? After all, more certainty is always better, isn’t it? Unfortunately, high confidence levels are not without cost. A higher confidence level leads to a wider confidence interval than that corresponding to a lower confidence level. For example, if you had a study of 100 people and 50 were able to complete your task, then the 95% confidence interval will be 20% wide (from 40% to 60%), but the 80% confidence interval will be only 12% wide (from 44% to 56%). If you wanted to get a 95% confidence interval that is 12% wide, you would need to recruit another 140 users (for a total of 240 study participants). That is a significant expense that could be well justified in many situations, but certainly not in all.
Think of a lower confidence level as if it were a sloppier, less resource-intensive calculation. If you’re betting $5 that your completion rate is between 44% and 56%, then it probably doesn’t make sense to spend a lot of resources to have a 95% confidence level. It’s not such a big deal that you’re wrong. But if you’re betting 5 million dollars, then you probably want to be as sure as possible. (And if you were betting billions of dollars, a 5% risk of being wrong would be unacceptable and you would need a confidence level of 99% or better. However, no individual design decisions are worth billions, though the biggest ecommerce sites are worth that much in the aggregate.)
Conclusion
Confidence intervals are a statistical tool for determining how well a study predicts the behavior of the whole population. Any metric resulting from a study, whether it’s success, task time, number of errors, or conversion, needs to be accompanied by a corresponding confidence interval.
Narrow confidence intervals carry more information and are more desirable, but usually require larger sample sizes. That’s why small studies are unlikely to be representative for the behavior of the whole user population.
Confidence-interval calculation is probabilistic and can occasionally be wrong, but the chance of it being incorrect can be controlled by the researcher. A higher confidence level will more often result in a correct range, but it is more costly. Researchers can choose the right confidence level for their metrics based on what’s at stake and on the resources that are available to them.


Share this article: