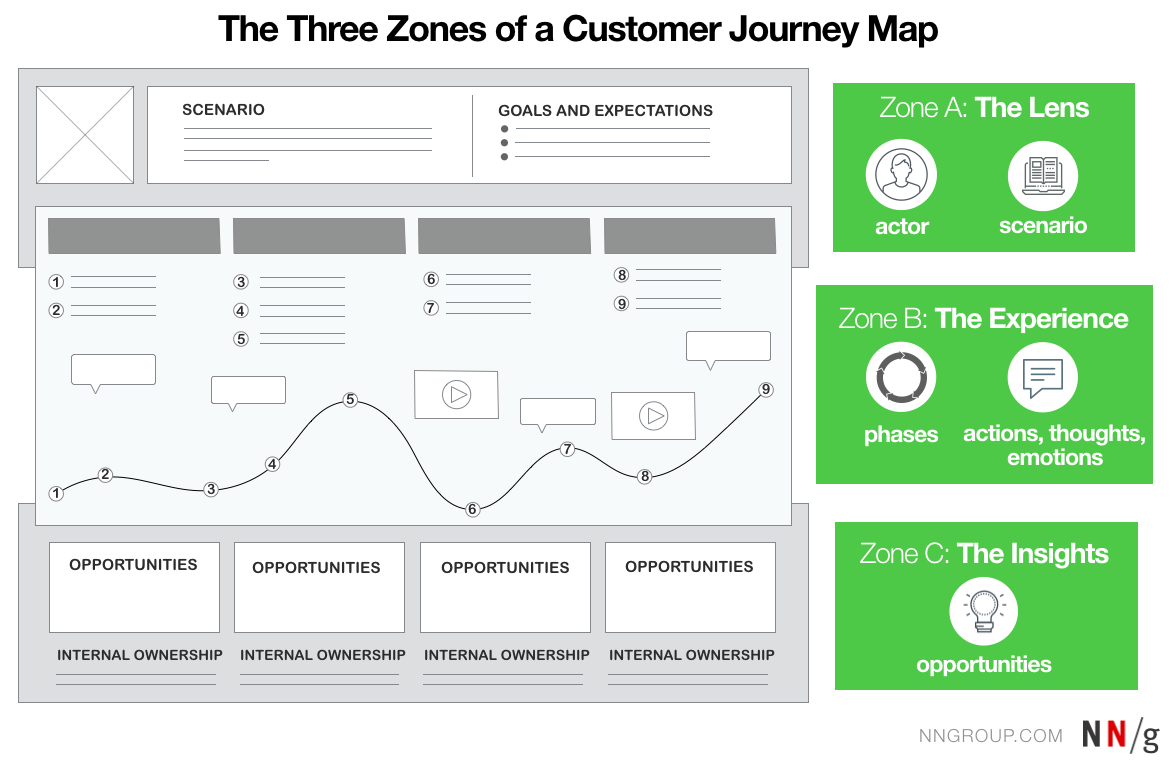
Journey maps are visualizations used for understanding customer needs and pain points as people interact with an organization. They typically include three zones: a lens that provides focus and context for the journey being mapped, an area depicting the user’s experience, and a third zone for insights derived from analyzing the journey. Journey maps can be an effective communication tool within an organization and can focus team effort on the right outcomes.
Survey Overview and Takeaways
In preparation for our seminar Journey Mapping to Understand Customer Needs , we surveyed 48 user experience professionals to find out how organizations use journey mapping.
We asked participants the following questions:
- Which elements do you typically include in journey maps?
- What do you find to be the most frustrating or unhelpful part of using journey maps?
- What do you find to be the most helpful results, outputs or benefits of using journey maps?
- When does journey mapping fail?
- When does journey mapping succeed?
One of the most interesting takeaway from answers is that the journey maps’ effectiveness within the organization was seriously undermined when the journey maps were simplified to leave out the insights area (the area of a customer journey map where opportunities, ownership and metrics are included — see image below). The majority of respondents in fact omitted this area, and they also struggled with lack of buy-in from management and with weak follow-up actions.
Themes in both the benefits and pain points of journey mapping also emerged. Most often, creating a common vision was cited as a benefit of journey mapping. Having a clear understanding of process and scope before engaging in journey mapping was the most frequently cited pain point.
Q1: Which Elements Do You Typically Include in Journey Maps?
The answers to this question show that most practitioners include elements from Zone A: The Lens , and Zone B: The Experience in their journey maps. Personas and scenarios are used in almost 80% of journey maps created by the participants. Furthermore, respondents reported that user actions, thoughts, and emotions are commonplace within their maps. However, the data also reflects that most practitioners do not include any elements of Zone C: The Insights in their maps.
Insights are crucial for transforming journey maps from a visualization of a narrative into an action plan for implementing change and optimizing experiences. With no opportunities identified, the journey map is not actionable. Without ownership specified, there is no accountability for change. And lacking metrics, there is no way to understand how the organization can measure whether implemented changes do actually improve the experience.

Q2: What Is Frustrating About Journey Mapping?
Respondents’ answers to this question surfaced three main categories of frustrations. Over half (52%) of the responses were frustrations regarding the appropriate process and scope of journey maps. Creating maps that reflect reality and obtaining buy-in from management were also frequently cited frustrations.
1. Understanding process and scope (52%)
The most frequent frustration participants reported with journey mapping was inconsistencies and ambiguity with process and scope. They found it difficult to set constraints appropriately in order to define the scope, as well as to standardize a method and process for creating the map. As one participant expressed , “ill-defined [process] mean that the journey map can answer the wrong question.”
2. Obtaining data to represent reality (15%)
Respondents struggled with the process of collecting data and ensuring that their maps actually reflected users’ realities, and not just superficially capturing users’ goals and needs. Additionally, they found it challenging to keep stakeholder assumptions from turning into “data” points on the map.
3. Obtaining buy-in from others (15%)
Participants reported that getting stakeholders to commit to the process of journey mapping can be challenging, especially since journey mapping often requires people from across different disciplines and departments to work together.
Q3: What Is Beneficial About Journey Mapping?
Respondents’ answers focused on five key areas, with over a third centered on the belief that the activity of journey mapping creates common goals and vision across individuals and departments.
1. Creates common goals and vision (32%)
In 32% of responses, participants reported that they believe the activity of journey mapping helps align stakeholders around a common vision and shared goals. As one participant said, “ The greatest benefit is to grow cross-department consensus and develop a shared vision of how to meet the needs of (and even delight) users.”
2. Uncovers hidden truths (24%)
Not surprisingly, participants also stated that the activity of journey mapping often reveals hidden truths and insights that were previously unknown. Journey maps “ often showcase situations that no one had planned for ,” reported one participant, and “ uncover interactions…that we hadn't thought about previously ,” said another.
3. Facilitates collaboration (18%)
Participants appreciated that journey maps, when cocreated with other teams and people, can help align stakeholders and facilitate collaboration between groups. Simply getting a team together to focus on the customer helps overcome the metaphorical (or actual) walls between departments.
4. Enables customer-centric focus (18%)
Several responses suggested that journey maps help teams concentrate on customers and design around their needs. They “ help the team understand how users feel and what they need most ,” reported one participant.
5. Creates personal connection (12%)
One of the less obvious benefits that emerged as a theme was that journey mapping helps individuals see the impact of their daily work. Some participants felt that simply visualizing the journey helped enable a personal connection to that journey for people within the organization, because they could see how their efforts created positive or negative points within the greater customer experience.
Q4: When Does Journey Mapping Fail?
Perhaps the most important shared insights from the professionals surveyed were the responses to the question, “When does journey mapping fail?” Respondents shared their stories of when journey mapping was a fruitless endeavor because it was not shared, no buy-in occurred, the map wasn’t based in reality, or there was not a defined focus ahead of time. Four key scenarios for failure emerged:
1. When there’s no focus (36%)
Journey maps were reported to fail most frequently when the purpose was not clearly defined upfront. Without this constraint defined, journey maps become too general and unfocused, participants said.
2. When it’s not based in reality (25%)
As mentioned early, professionals often struggle to obtain the data necessary to create maps that reflect reality. Responses reinforced the point that maps created from preconceptions and assumptions that are not then validated with user research fail to gain any traction.
3. When it’s not shared or used (21%)
Popularization of findings is key for creating successful journey maps. When the insights are not well communicated, the output becomes “ just a pretty map that no one uses ,” in the words of one participant.
4. When there’s no trust or buy-in (11%)
A smaller number of respondents brought up the fact that because journey mapping is designed to uncover and eliminate weaknesses within the customer experience, some clients or internal teams may be fearful of exposing those weaknesses. Additionally, some participants felt that journey mapping must be an activity that has support throughout the organization, not simply from the team leading the endeavor.
Q5: When Does Journey Mapping Succeed?
As one might imagine, participants’ responses to this question are somewhat the opposite of the responses to the previous question, “When does journey mapping fail?” For example, participants said that maps must be focused on a clear goal and scenario, as well as built collaboratively and shared with others after their creation.
However, practitioners also emphasized that journey maps need to lead to action, and, even more importantly, produce measurable results.. These results make the finding that insights such as opportunities, ownership and metrics are often left out of journey maps even more significant. Four key scenarios for successful maps emerged:
1. When it’s collaborative and shared (37%)
Almost 40% of participants felt strongly that journey maps must be created as a team and continued to be shared and developed with many people in order to be successful. In the words of one respondent, journey maps are successful “ when everyone from top to bottom, from product to sales via marketing, contributes and therefore feels involved .” Involving others helps to create buy-in and ensure that the findings are known and understood by many people.
2. When it leads to action (27%)
About a third of the answers to this question brought up the key point that journey maps are not successful if they are not actually used to inform design decisions. Only when actions are taken based on map-provided insights do they become a useful tool, said some participants.
3. When it’s focused (13%)
A smaller theme that emerged was that maps cannot be successful without focus. Participants felt that purpose and goals must be clearly defined, and that they are best when they center on one key scenario so that they do not become overly complex.
4. When it produces results (13%)
Finally, several participants felt that journey maps should be produce measurable results that improve customer experience and demonstrate ROI. This finding makes the lack of metrics or opportunities in most maps even more significant.
Conclusion
Given the high demand placed on journey maps to lead to action and produce results, it is critical to include insights such as opportunities, ownership, and metrics within a customer journey map, yet these elements are omitted from maps to a startling degree.
In order to create a map that has more potential to incite change and product results, ensure that your maps are:
- Focused. Articulate and document your business goal before beginning the mapping process. Focus on a well-defined scenario and actor in order to set constraints for the journey map.
- Socialized. Pulling stakeholders into the actual mapping activities will go a long way in generating buy-in early in the process, and it will ensure that multiple perspectives are used as resources for knowledge. After the journey map is created, don’t stop. Share the journey map with others, using those previously involved stakeholders to help sell the narrative and build additional consensus on the vision.
- Truthful. Base your journey map on data. The narrative of a journey map does not necessarily map one-to-one to data points, but you should be ready to explain where the data came from and how the story was created.
Focused, socialized, truthful journey maps lead to action that can produce results.
Learn more about effective journey mapping in our course Journey Mapping to Understand Customer Needs .


Share this article: