Likert and semantic differential are two types of rating scales often used in UX surveys. They often get confused because the differences between them are subtle. However, they shed light on attitudes and preferences in slightly different ways.
How UX Professionals Use Rating-Scale Questions
We often measure attitudes, perceptions, beliefs, preferences, and self-reported behavior using rating-scale questions. These types of questions allow for degrees of opinion.
Rating-scale questions appear in various research methods. The most common application of rating-scale questions is, of course, in surveys. However, rating-scale questions are also often administered in quantitative usability tests. The attitudinal data produced from rating-scale questions helps us understand how users perceive our product or service, in addition to how they performed a given task. This data provides us with a richer picture of the overall user experience.
Likert Scale
The Likert scale (pronounced Lick-urt) is named after the psychologist Rensis Likert, who created the Likert-scale method in the 1930s.
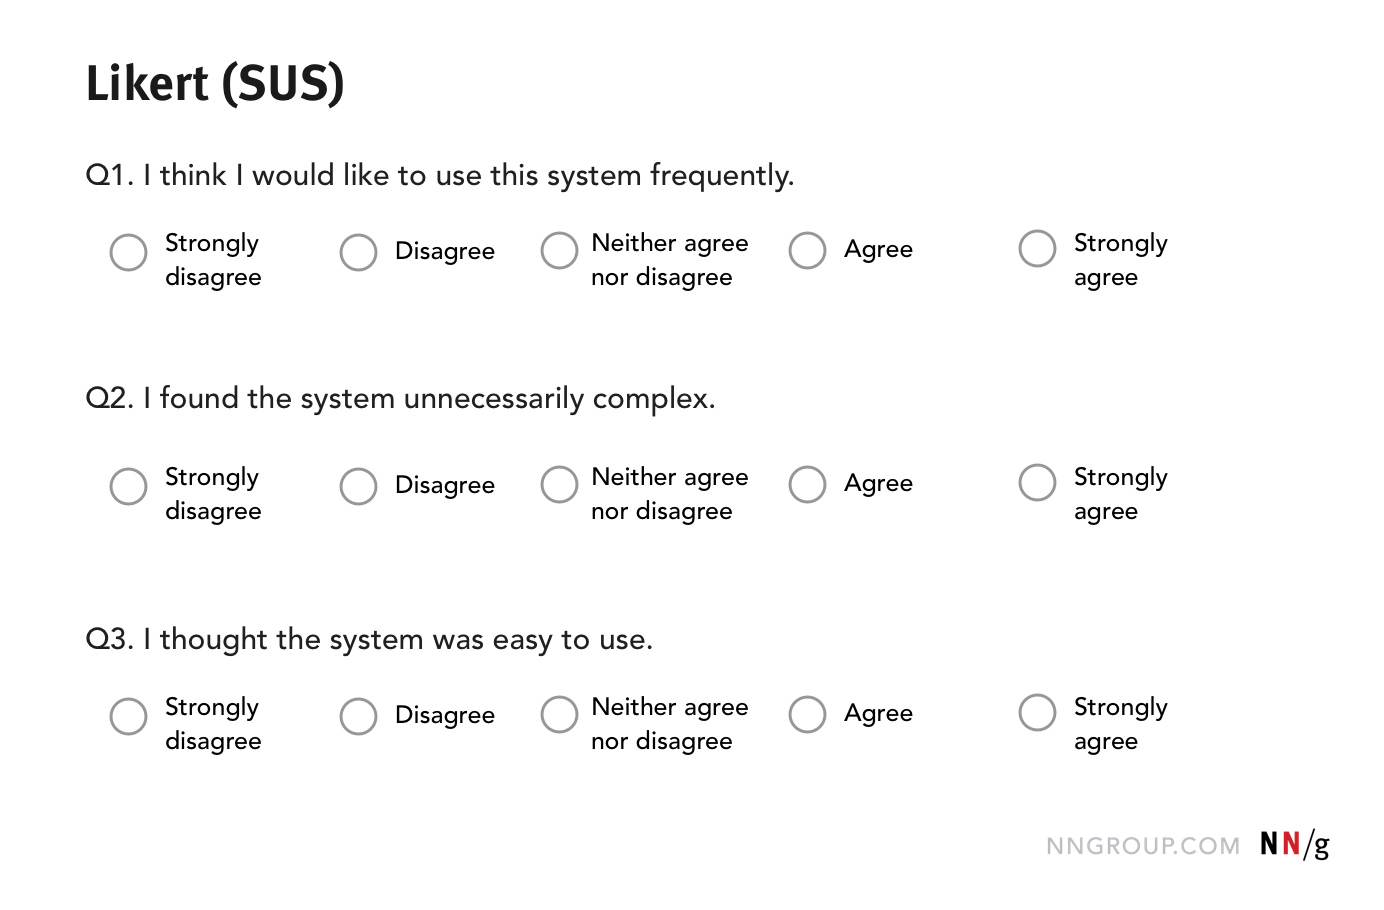
Likert scales measure agreement. In a Likert scale, respondents are asked how much they agree or disagree with a set of statements. An overall position is derived after analyzing all responses to related questions. Usability assessment questionnaires, like System Usability Scale (SUS) and Standardized User Experience Percentile Rank Questionnaire (SUPR-Q), use a Likert scale. (Technically, one question on its own is not a Likert scale, but is a question utilizing a Likert-type response format. A single question is referred to as a Likert item.)
Likert scales (and the Likert-type response format) are vulnerable to two response biases:
1) acquiescence bias
2) social-desirability bias
- The acquiescence bias is people’s tendency to agree with others. This phenomenon is not surprising — after all, it is our nature to be agreeable. Acquiescence occurs because participants are primed by the positive (or negative) statement that they have to agree or disagree to. This type of behavior is an example of a framing effect — when a positive (or negative) aspect of a situation is emphasized, people tend to see the whole situation as positive (or negative, respectively).
One way to circumvent this issue is to alternate positively phrased statements with negatively phrased ones. For example, the SUS questionnaire alternates between positive and negative statements (as shown in the figure above). However, taking this approach is not without its own difficulties. Sauro and Lewis (2011) found that alternating between positively and negatively phrased statements can lead to confusion among both participants (who might not read the statements carefully enough to notice the alternation) and researchers (who might not realize that the responses to negative and positive questions must be coded differently).
- The social-desirability bias is the desire to report views that will be regarded favorably by others. When respondents feel there is an accepted position, they will be more likely to agree with that position out of fear that disagreement may reflect badly upon themselves. (For example, if people feel that political correctness is the accepted position, they may be reluctant to report personal attitudes that go against this view.) To minimize this bias, don’t ask respondents for their name or other identifying information. Researchers have found that asking for names and other identifiers in surveys increases the social-desirability bias.
Semantic Differential
The semantic-differential question was introduced in 1957 by Osgood, Suci, and Tannenbaum in the book The Measurement of Meaning, and has since become popular.
Semantic-differential questions require respondents to rate their attitude by selecting a position on a bipolar adjectival scale. The two ends of the scale host antonym adjectives (e.g., ugly – beautiful, easy – difficult). The Single Ease Question (SEQ) is an example of a semantic differential scale. The SEQ presents a 7-point scale with the ends labeled very easy and, respectively, very difficult.
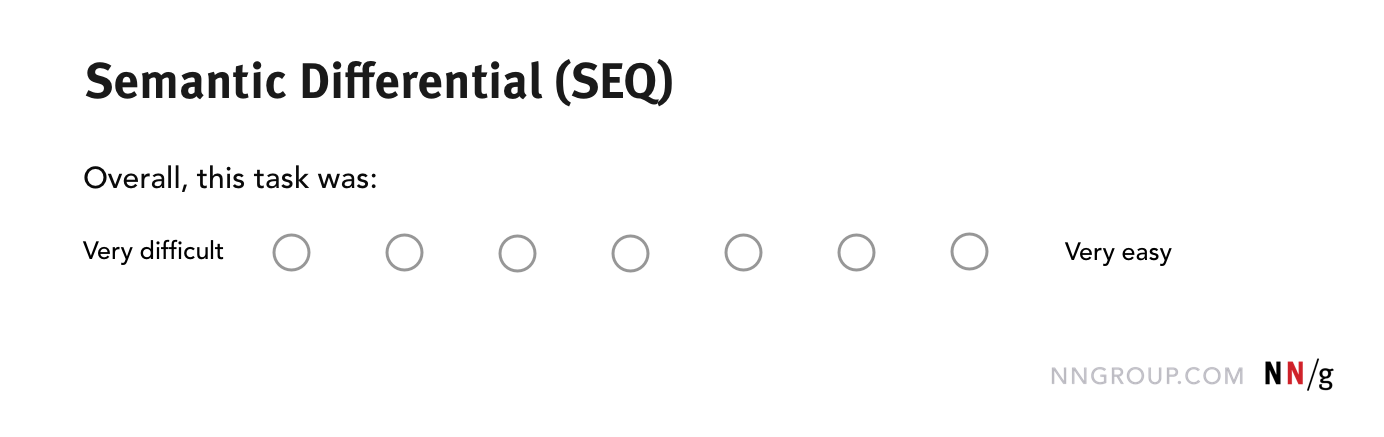
In most applications of the semantic differential, the options that can be chosen along the continuum are not labeled, as they are supposed to represent abstract points; however, variations exist where the intermediate points are either numbered (e.g., -3 – +3) or labeled with words such as very, somewhat, neither nor.
While research has found that people find it easier to comprehend word-labeled scales compared to unlabeled ones, it can be hard to come up with the right word to describe an intermediate point on a scale.
The data produced from a semantic-differential question is reliable only if two assumptions are satisfied. These are:
- The pair of adjectives are truly bipolar. However, it might not always be possible to find a dichotomous pair of adjectives.
- The respondents understand the dichotomy between the pair and the continuum between them. However, because the scale is not labeled, each option could be interpreted differently across multiple respondents.
Likert vs. Semantic Differential
Although both rating scales allow for degrees of opinion, there are subtle differences between them. Answering a semantic differential requires more cognitive effort than answering a Likert-scale question, as respondents must think abstractly about their attitudes in order to select an option, most notably because the points on the scale are unlabeled. However, the cognitive flexibility of the choices means respondents don’t feel trapped by a particular label, which is possible with a Likert scale.
The comparison table below highlights some of the differences between the two types of question.
| Likert items | Semantic Differential | |
|---|---|---|
|
Information obtained |
Agreement or disagreement to statements | Where the respondent’s view lies on a continuum between two contrasting adjectives |
| Number of options presented for selection | Typically, 5, but the number can be as many as 7 or 9 | Typically, 7, but the number of points can vary |
| Labels for options | Each option is labeled with words. (If more levels are included, the continuum might not be fully labeled, as it’s difficult to summarize the extent of agreement when there are more than 2 agreement options.) | The two polar sides are labeled, but the options are typically not labeled, or are labeled only with numbers. |
| Limitations | Affected by acquiescence bias and social desirability bias |
Requires higher cognitive demand to answer due to unlabeled options |
| Information obtained |
Likert items: Agreement or disagreement to statements Semantic Differential: Where the respondent’s view lies on a continuum between two contrasting adjectives |
|---|---|
| Number of options presented for selection |
Likert items: Typically, 5, but the number can be as many as 7 or 9 Semantic Differential: Typically, 7, but the number of points can vary |
| Labels for scale points |
Likert items: Each option is labeled with words. (If more levels are included, the continuum might not be fully labeled, as it’s difficult to summarize the extent of agreement when there are more than 2 agreement options.) Semantic Differential: The two polar sides are labeled, but the options are typically not labeled, or are labeled only with numbers. |
| Limitations |
Likert items: Affected by acquiescence bias and social desirability bias Semantic Differential: Requires higher cognitive demand to answer due to unlabeled options |
In some situations, it’s possible to use either a Likert item or a semantic differential for a given research question. For example, if we wanted to understand how satisfying our website is to use, we could ask how much a user agrees or disagrees with the statement: The website was satisfying to use. We could also create a semantic differential question, which asks: How satisfying was using the website? The poles of the scale contain the words ‘satisfying’ and ‘unsatisfying’. Both of these questions help us to understand the users’ perception of the ease of use of our website.
However, there are situations when it is difficult or impossible to use a semantic differential. For example, consider the statements below that were presented as a Likert scale in a survey of UX practitioners.
- We don't begin thinking about solutions until we've completed our discovery.
- We are given time to do enough discovery work before we begin designing new features, products or services.
- The team involved in the discovery all work together collaboratively, sharing work.
- Our discoveries are centered around user research with our target users.
Converting the above to semantic differentials would not be possible without changing the type of information we are trying to garner from respondents.
Thus, overall, questions that use a Likert-type response format are more flexible, and have a greater number of applications.
Tips for Using Rating Scales in UX Surveys
If you’re thinking of using rating scales in your survey, then here are some tips.
- If you want to evaluate the ease of use of an interface, use standardized usability questionnaires which have been tried and tested and have undergone psychometric testing, instead of creating your own.
- If you’re not sure which style of rating scale to use, test them both. Do an in-person qualitative survey to test the comprehension of the question and of the answer options. Ask your participants to think aloud while they complete the survey. You can also trial both versions of the survey and compare the responses to decide whether you should use a Likert or a semantic-differential scale. Consider the audience: will people struggle to answer a semantic differential, or will they be prone to agree too much?
- Use existing scale labels when designing a question using a Likert-type response format. Stick to the typical ways of phrasing agreement and disagreement (strongly agree, agree, neither agree nor disagree, etc.), rather than reinventing the wheel and creating new response options.
- Ensure your polar adjectives are true opposites when designing semantic- differential scales. For example, go for well-accepted pairs like interesting vs. boring, as opposed to odd pairings such as cool vs. strange. Test with users in person to understand if word pairings are seen as bipolar before implementing a large-scale quantitative survey.
- Include optional text fields so you can get more insight. A question like Why did you choose this rating? garners the thought process behind choosing an option on the scale.
- Add a Not applicable option for those questions that might not apply to all your respondents. This extra choice allows you to disambiguate any neutral respondents from respondents who don’t believe the question is relevant to them.
Conclusion
Likert and semantic differential are two types of rating scales often used in UX research. Both are tried and tested ways to measure degrees of opinion related to the experience of products and services; however, they do so in slightly different ways. Pick the right style of rating scale to suit your research aims and be aware of the limitations and nuances of both.
References
Likert, R. (1932). A Technique for the Measurement of Attitudes. Archives of Psychology, 140, 1–55.
Osgood, C.E., Suci, G.J., and Tannenbaum, P.H. (1957). The Measurement of Meaning. University of Illinois Press, Urbana, Illinois.
Sauro, J., Lewis, J.R. (2011). When designing usability questionnaires, does it hurt to be positive?. Proceedings of the SIGCHI Conference on Human Factors in Computing Systems (CHI '11). 2215–2224.


Share this article: